
Federal Reserve Chairman Jerome Powell said the central bank will continue to use “powerful tools” to reduce inflation. Thus, he signaled that the FED’s hawkish policy could stay for a while. He also warned that future decisions could “bring some pain to households and businesses.” On top of that, prices in Bitcoin, SHIB and other altcoins collapsed. So what levels are next for prices?
FED effect on the cryptocurrency market
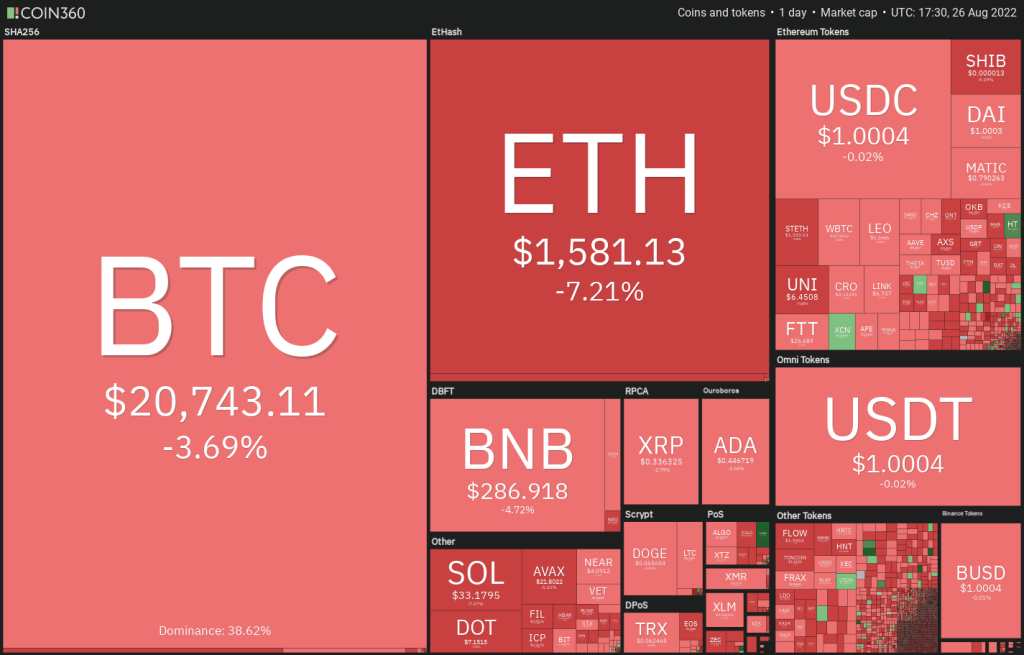
U.S. stock markets reacted negatively to Powell’s comments, with the Dow Jones Industrial Average falling more than 600 points. The cryptocurrency market witnessed sharp sales in Bitcoin (BTC), SHIB and altcoins. Following these sell-offs, most cryptocurrencies have fallen to or are on the verge of falling to sudden support levels.
An unsupportive macro environment continues to dominate the market. However, Bitcoin’s historical data for September is also a negative data. Bitcoin dropped an average of 6% in September, according to data from CoinGlass. September provided negative returns to investors between 2013 and 2021, with the exception of 2015 and 2016.
What levels are next for Bitcoin, SHIB and these 8 altcoins?
Could Bitcoin and major altcoins remain weak in the near term? An analyst analyzed the top 10 cryptocurrencies to find out the answer to this question. we too cryptocoin.comWe shared the analyst’s views for our curious readers.

Bitcoin (BTC)
Bitcoin’s shallow recovery from the support line of the ascending channel showed the bulls to be cautious at higher levels. Accordingly, the falling 20-day EMA ($22,249) and the RSI in the negative territory indicate the bears’ dominance. Strong selling pulled the price below the ascending channel on August 26. If the bears hold the price below $20,762, selling will intensify and Bitcoin will drop to $18,900.
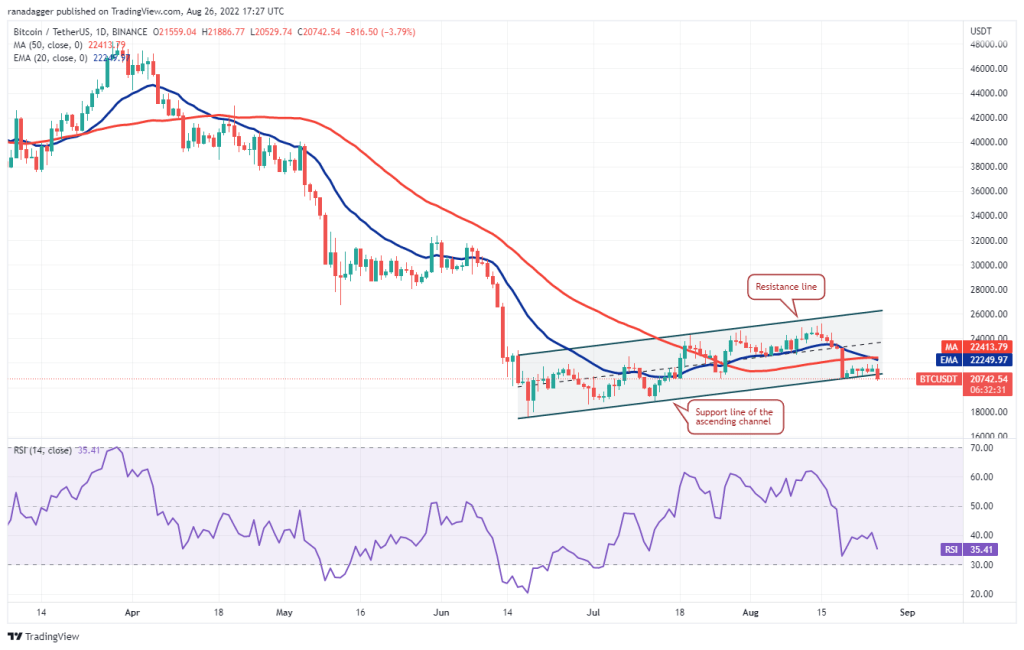
It is possible that this level will again act as a strong support. If it does, however, the drop could extend to the intraday low of June 18 at $17,622. This negative view will soon be invalidated if BTC rises from the current level and rises above the 50-day SMA ($22,414). This move will show that buyers are entering the leading cryptocurrency. Therefore, the bulls are likely to attempt a rally towards the resistance line of the channel.
Ethereum (ETH)
Buyers failed to push Ethereum (ETH) above the 20-day EMA ($1,697) on August 25. Accordingly, the bears continue to fiercely defend this level. Selling gained momentum and the bears pushed the price below the 50-day SMA ($1,588). A close below this support has the potential to drop the ETH price to $1,500.
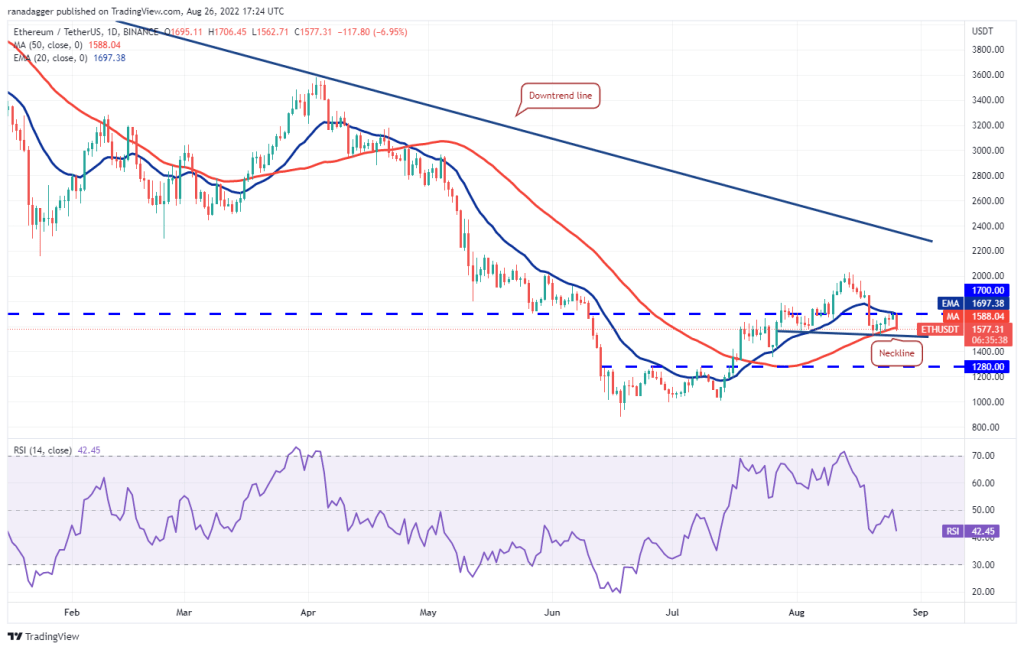
Also, if Ethereum breaks below this critical support, the pair will complete its downtrend. This model will then target $1,050. Contrary to this assumption, if the price bounces back from the $1,500 support, the bulls will again attempt to clear the overhead barrier at $1,700. If they are successful, it will suggest that the pair could rally towards the overhead resistance of $2,000.
Binance Coin (BNB)
The bulls pushed BNB above the 20-day EMA ($300) on August 25. However, the long wick on the candlestick indicates that the bears are selling higher. BNB fell on August 26. Now the bears are trying to push the BNB price below the immediate support at $275. If successful, the BNB/USDT pair will complete a bearish head and shoulders pattern.
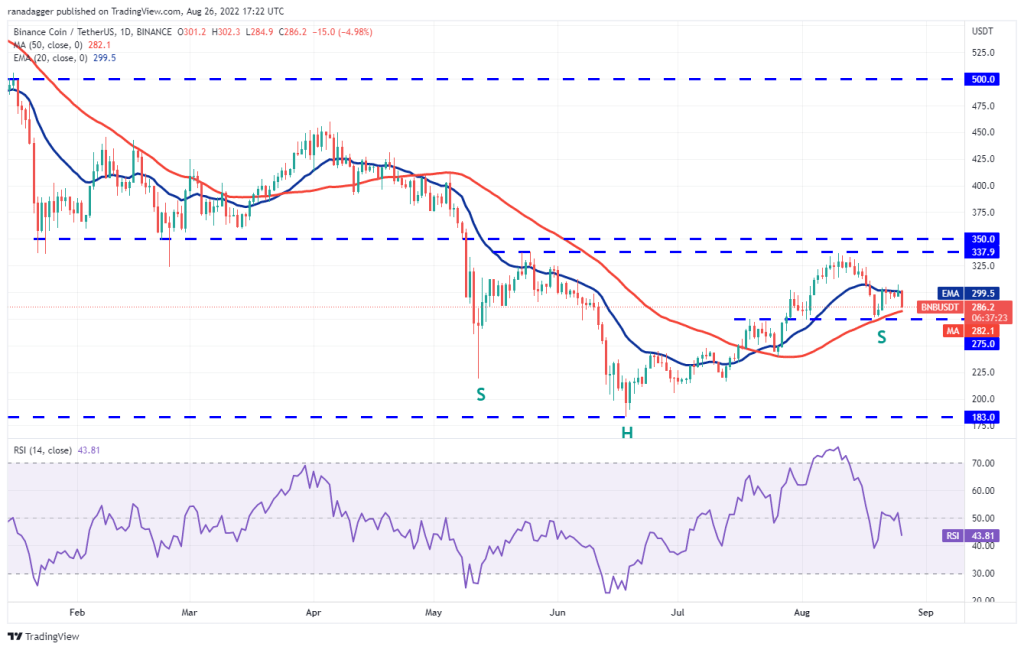
This suggests a move that will result in a bearish move to $240 and then to the $212 pattern target. Conversely, aggressive bears will be caught off guard if the price rises and rises above $308. It is possible for Binance Coin to rise to the overhead resistance of $338 later. If the bulls break this hurdle, the pair will complete the bull inverse head and shoulders pattern.
Ripple (XRP)
The bulls pushed Ripple (XRP) above the moving averages on August 26. However, the long wick on the candlestick indicates strong selling at higher levels. On top of that, XRP fell sharply. Currently, the bears are trying to push the XRP/USDT pair below the immediate support at $0.33.
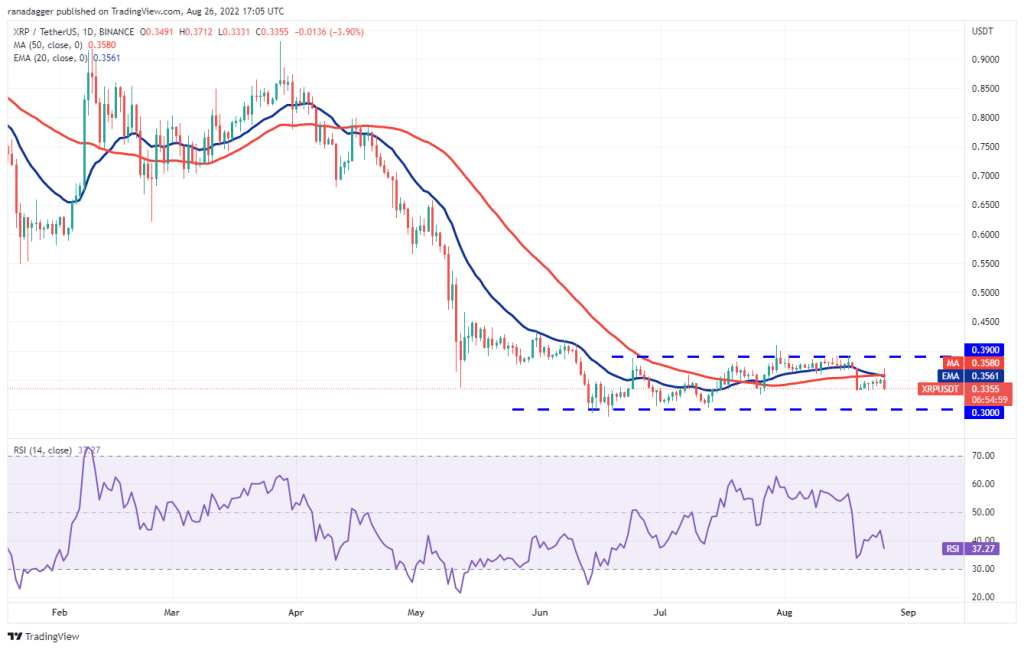
If they are successful, the next stop will be the critical support at $0.30. A break and close below this level will suggest a resumption of the downtrend. Alternatively, if ripple bounces back at $0.30, it will show that the bulls are continuing to buy from this level. This will increase the likelihood that the pair will stay between $0.30 and $0.39 for a while.
Cardano (ADA)
Cardano (ADA) fell sharply from the 20-day EMA ($0.49) after recovering. This indicates strong selling by bears at higher levels. It is possible for the altcoin to reach immediate support at $0.43. If this level is also lost, the next stop will be the crucial level at $0.40.
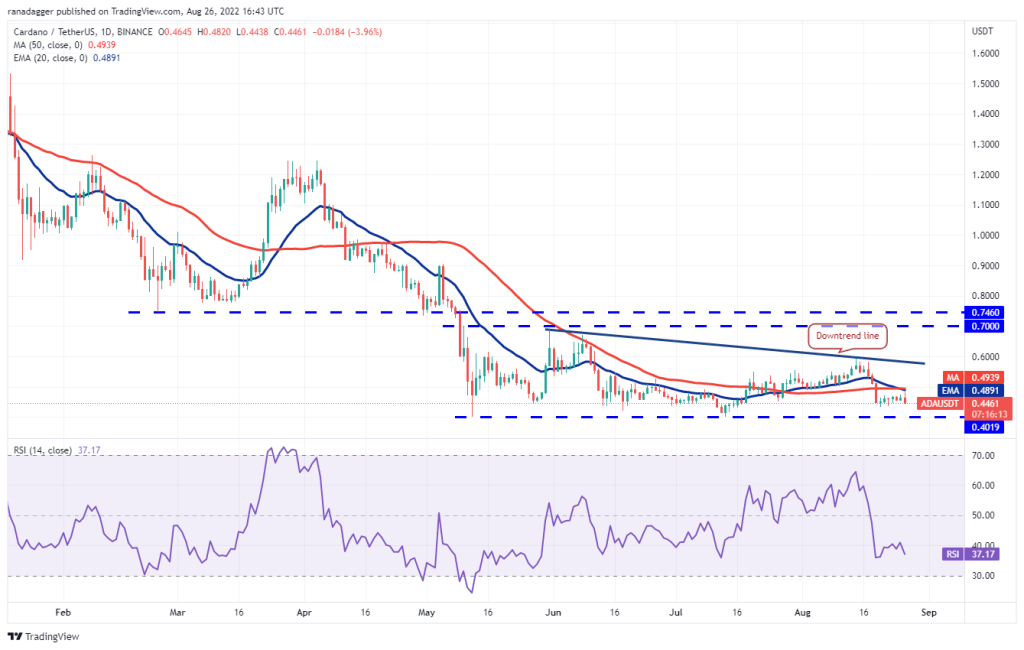
The bulls have successfully defended this support on two previous occasions. Therefore, the level seems to attract investors to Cardano to buy again. If Cardano bounces back from the current level of $0.40, the bulls will again try to break through the general hurdle in the moving averages. If they succeed, ADA will rise to the downtrend line where the bears can form a strong defense.
Left (LEFT)
Solana (SOL) is gradually falling towards the strong support at $32. Thus, it indicates a lack of demand at higher levels. The 20-day EMA ($38) is bearish and the RSI is in the negative territory. So the bears are in an advantageous position. If support at $32 collapses on Solana, Solana will drop to $26 which is vital support.
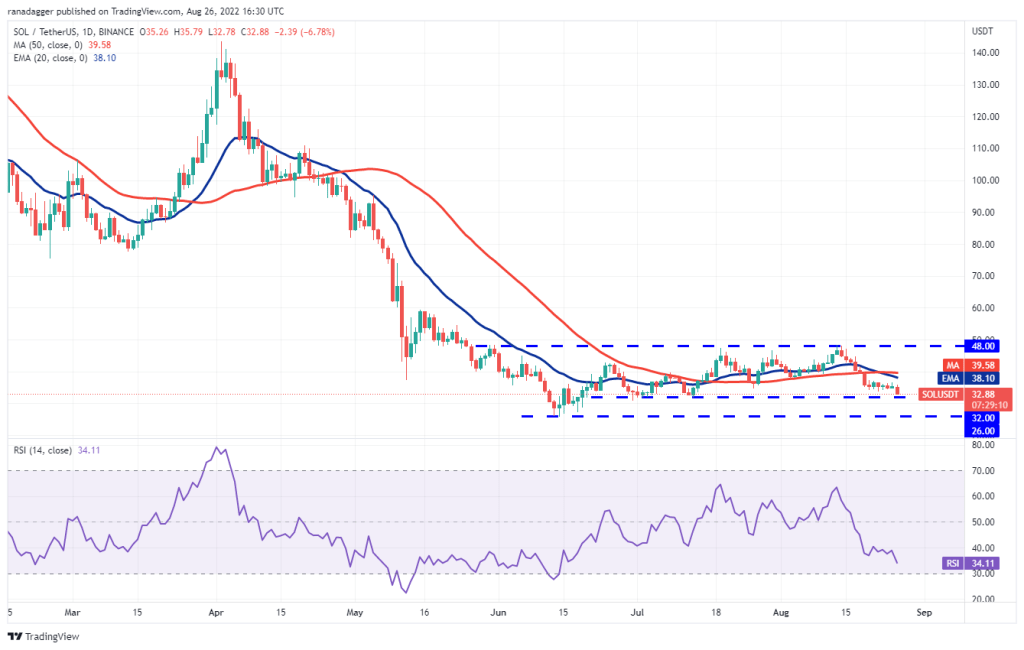
This is an important level to consider because a break below this will suggest a resumption of the downtrend. Contrary to this assumption, if the SOL bounces back from the $32 support, it will indicate that the bulls are buying dips to this level. Traders should consider that the range-bound move between $32 and $48 could continue for a few more days. For this, however, buyers need to push the price above the 50-day SMA ($39).
Dogecoin (DOGE)
Dogecoin (DOGE) rose marginally above the 20-day EMA ($0.07) on August 25. However, the bulls failed to sustain higher levels. This indicates that the bears are aggressively defending the level. The strong sell on August 26 pulled Dogecoin below the trendline of the ascending triangle pattern. If the SHIB opponent stays below the triangle, it will invalidate the bullish setup.
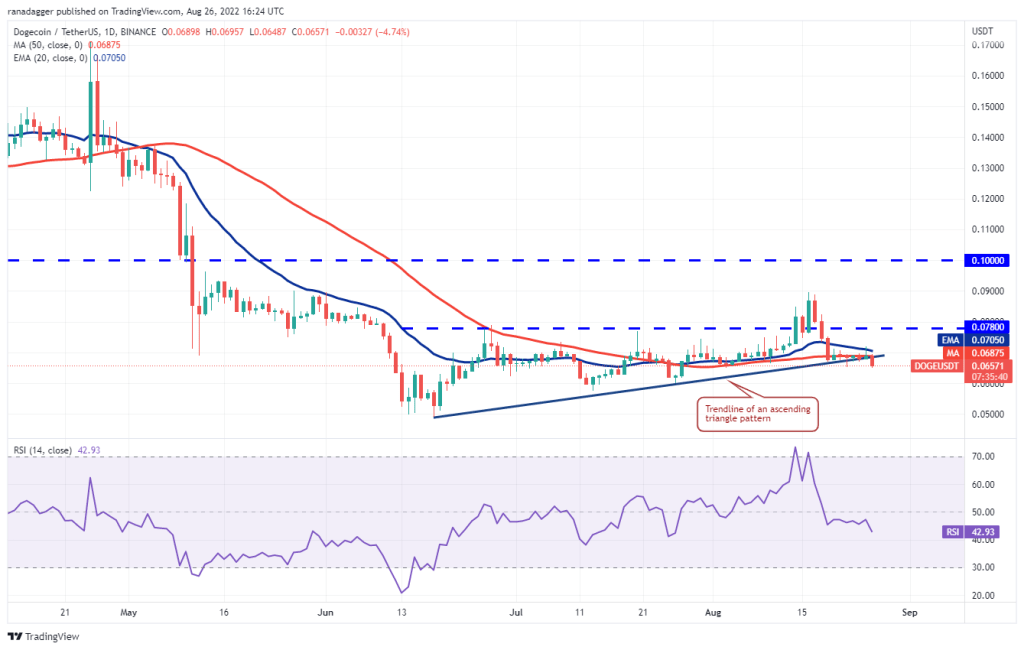
DOGE will later fall to $0.06 and then to $0.05. Alternatively, if the price bounces back from the current level, buyers will try to break through the general hurdle at the 20-day EMA again. If they are successful, the pair will rally to $0.08 and then to $0.09.
Polkadot (DOT)
The bulls have been unable to push Polkadot (DOT) above the 50-day SMA ($7.82) in the past few days. This shows that the bears continue to sell on small rallies. The falling 20-day EMA ($7.93) and the RSI in the negative territory suggest that the bears have a slight advantage.
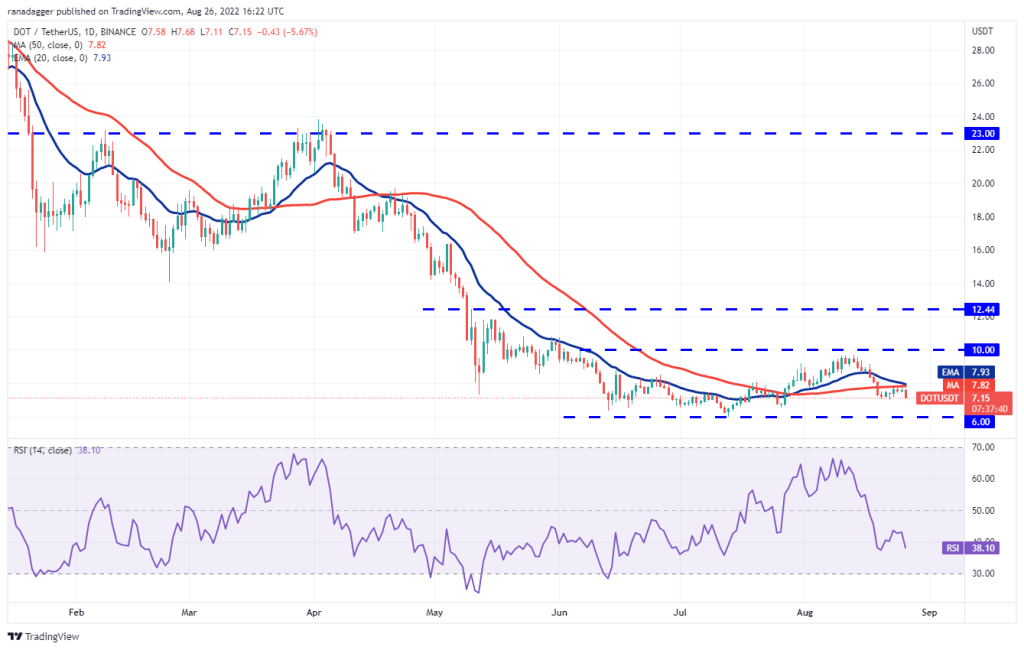
The negative momentum will increase if the bears sink the DOT price below the strong support at $7. If this happens, the DOT/USDT pair will drop to the crucial support at $6. Alternatively, if the price rises above the current level or $7 and rises above the moving averages, the pair will attempt a rally towards $9.17 and then the overhead resistance at $10.
Shiba Inu (SHIB)
The volatility of the Shiba Inu (SHIB) has increased and the bulls have pushed the price above the general resistance in the dollar. However, the long wick on the candlestick of the day indicates that the bears continue to sell in the rallies. The bears are currently trying to keep the meme coin below the 20-day EMA ($0.0000013). If they are successful, SHIB price will drop to the next $0.000012 support.
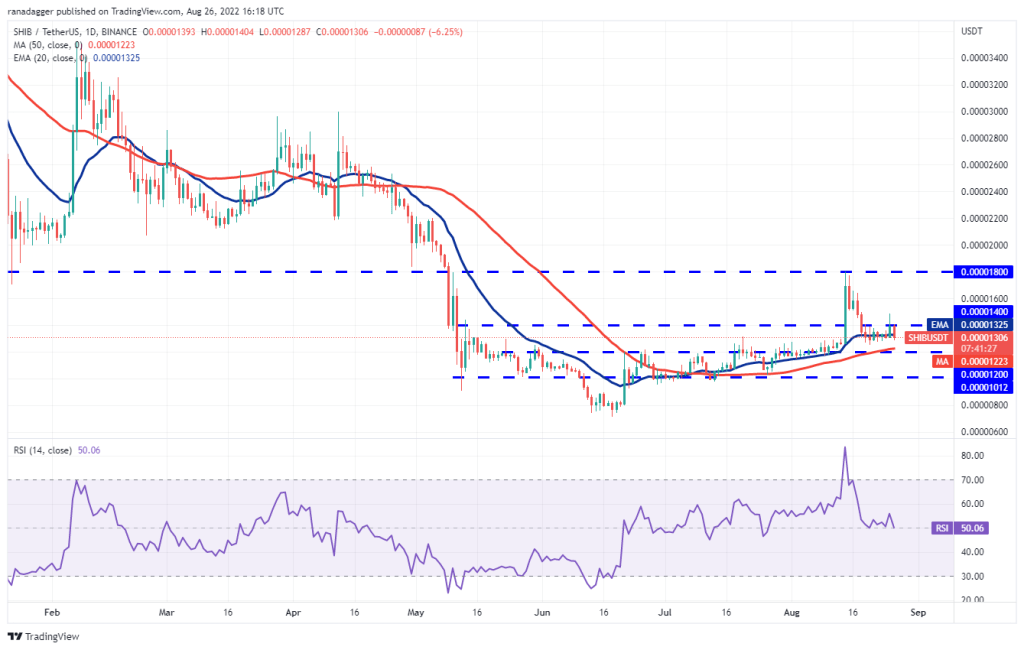
This is an important level for the bulls to defend. Because if it is broken, the decline has the potential to continue up to $0.000010. To invalidate this negative view, the bulls will need to keep the Shiba Inu above $0.000014. If they do, the pair will rally to the stiff overhead resistance at $0.0000018.
Polygon (MATIC)
The recovery of Polygon (MATIC) from strong support at $0.75 resulted in it facing resistance near the 20-day EMA ($0.85). This shows that sentiment is negative and bears are selling on rallies. Sellers will try to push MATIC price below the strong support at $0.75. If they are successful, the MATIC/USDT pair will drop to $0.63.
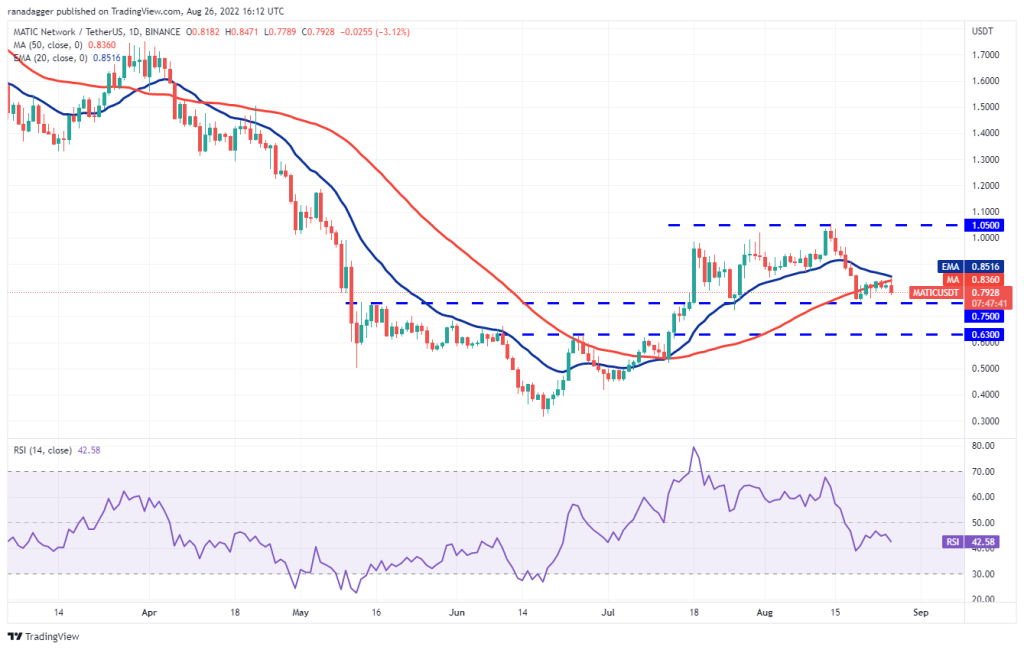
It is possible for the bulls to make a strong defense at this level. However, if the support is broken, the next stop will be $0.52. Also, this negative view will be invalidated in the short term if Polygon rises from the current level and rises above the 20-day EMA. If this happens, MATIC could attempt a rally towards the hard overhead resistance of $1.05.