
The gold price has recently hit monthly highs. Also, the yellow metal has caught a three-day uptrend. Meanwhile, risk appetite is waning amid headlines surrounding China and pre-NFP concerns. In addition, recession fears are contributing to the volatility of the Fedspeak market.
“The recent weakness of the gold price is due to these”
Gold price hit intraday lows as buyers gasped around a one-month high. However, he later recovered and continued on his way. Also, the yellow metal renewed the intraday low of $1,760 in the Asian session on Monday. Later, gold rose to $1,773. Market analyst Anil Panchal comments:
Gold’s recent weakness can be attributed to the cautious mood of the market ahead of the US jobs report for July. In addition, the fresh Sino-American struggles also have an impact. Additionally, the Fed’s preferred inflation indicator on Friday and optimistic pressures from the hawkish Fedspeak also weigh on gold prices.
Geopolitical and economic risks are increasing
Nancy Pelosi, Speaker of the US House of Representatives, begins her Asia visit. However, he does not mention his visit to Taiwan in the program. The reason is probably Beijing’s warnings. “Six people familiar with the Chinese warnings said they were significantly stronger than the threats Beijing made in the past when it was dissatisfied with US actions or policy towards Taiwan,” the Financial Times (FT) reports.
With this cryptocoin.com As you can see in , the US Core Personal Consumption Spending (PCE) Price Index, the Fed’s preferred inflation indicator, rose to 4.8% year-on-year in June, compared to 4.7% in the previous year. Following this, Minneapolis Fed Chairman Niel Kashkari made a statement to the New York Times (NYT). Kashkari stated that the Fed is still far from giving up on rate hikes. “It seems reasonable to me to raise interest rates by half a point at the next Fed meeting,” the policy maker said.
Markets will follow this data
Also, the recent drop in US Treasury yields and stronger stocks are weighing on the US dollar. It should be noted that this also supports the gold price. Also, US Federal Reserve Chairman Jerome Powell emphasized data dependency and neutral interest rates. Powell’s comments joined the “technical recession” in the US to bolster gold’s recovery over the past two weeks. The analyst makes the following comments in general terms:
The US ISM Manufacturing PMI for July is expected to be 52 compared to the previous 53. It is possible that gold price movements are ahead of this data. Meanwhile, headlines surrounding Fedspeak and China will also be important. However, amid neutral rates and economic slowdown projections, Friday’s US Non-Farm Payrolls (NFP) will be of great importance.
Gold technical analysis
Market analyst Anil Panchal analyzes the technical outlook for gold as follows. The overbought RSI (14) seems to have triggered a pullback in the gold price after the previous week’s multiple failures to break past the 200-SMA. However, a successful break of the downward sloping trendline, which is around $1,746 as of June 12, keeps gold buyers hopeful.
Even if precious metal prices dip below $1,746, a convergence of the 50-SMA and one-week support line to $1,727 will be a hard nut to crack for short-term bears. Alternatively, a surge above the 200-SMA near $1,770 would need confirmation from the July 01 low of $1,785 to entice buyers.
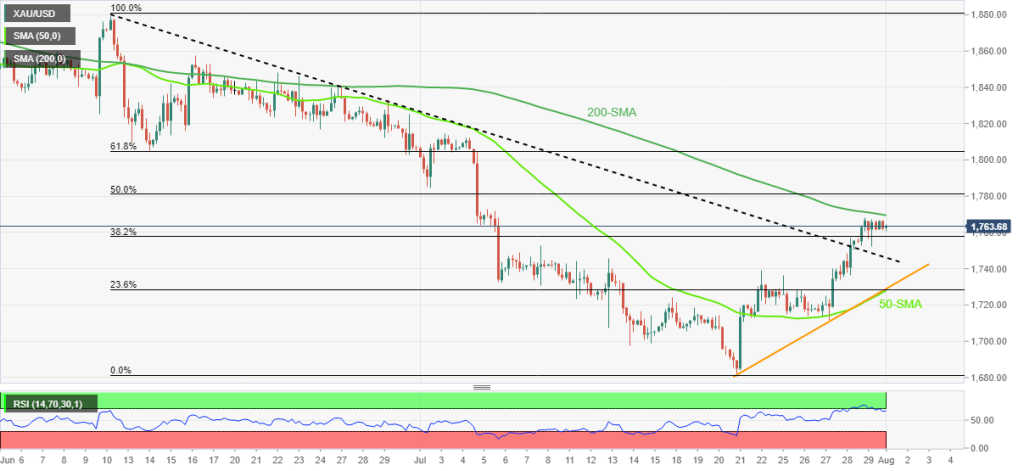 Gold price/ four hour chart
Following this, the 61.8% Fibonacci retracement of the June-July decline is likely to challenge the gold bulls around $1,805. Overall, it’s possible for gold to witness a pullback. However, bears need to remain cautious until they witness a sustained break of the $1,727 support.
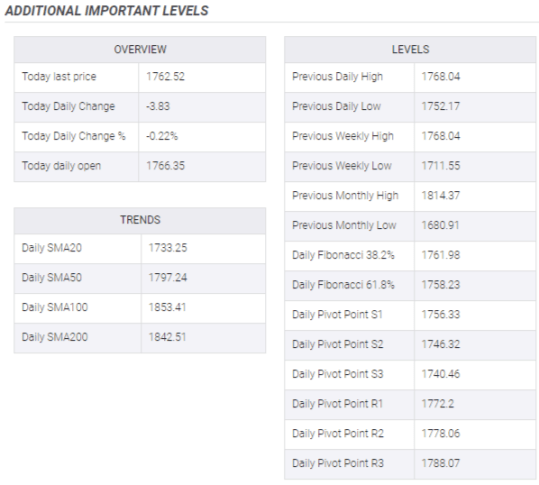 Additional key levels to watch


