According to TDS, gold prices have not seen the effects of a continued period of restrictive interest rates. Therefore, economists expect the yellow metal to remain vulnerable. Technical analyst Ross J Burland notes that the golden bears are moving back after a significant bullish correction. Next week’s US CPI data will be critical on the pre-Fed calendar.
Markets will follow US CPI
cryptocoin.com As you follow, the US dollar flew to the moon. As a result, gold prices came under pressure again. Meanwhile, speculation persists that central banks will continue to pursue aggressive monetary policy. In the midst of this, the yellow metal fell from a one-week high. Gold was trading around $1,704 at press time. The bright metal has slumped from a daily high of $1,707 to a low of $1,691.
Meanwhile, there are signs that the Fed will raise 75 basis points instead of 50 basis points. That’s why next week’s US CPI is very important. Markets will follow the core CPI rate. Fed funds futures are priced at a 73% chance for the Fed to raise rates by 75 basis points. Also, US benchmark Treasury yields hit their highest levels since June. Expectations that the Fed will continue to increase interest rates were effective in this. This, in turn, increased the opportunity cost of holding the unyielding yellow metal.
“Great possibility of capitulation, increasing every second”
Gold markets failed to price the effects of a continued period of restrictive interest rates. Therefore, economists at TD Securities expect the yellow metal to remain vulnerable. According to economists, historical data shows that periods when market expectations for the real Fed funds rate are above the natural rate estimates are accompanied by a persistent underperformance in gold prices. Economists also make the following assessment:
By contrast, although gold prices have now accurately captured the expected level of interest rates, they do not reflect the results of a continued period of restrictive policy. With every drop in gold prices, we see the possibility of a major capitulation event escalating. This could also coincide with a break below a ten-year uptrend in the yellow metal around $1,675.”
Gold prices technical analysis
Technical analyst Ross J Burland draws the technical picture of gold as follows. According to the pre-opening analysis, the bears are looking for a break in the ten-year uptrend around $1,676. The price has since corrected with a strong sell-off on the daily timeframe. Later on, the bulls turned bullish. As you can see in the chart below, a deeper correction was expected at the beginning of the week.
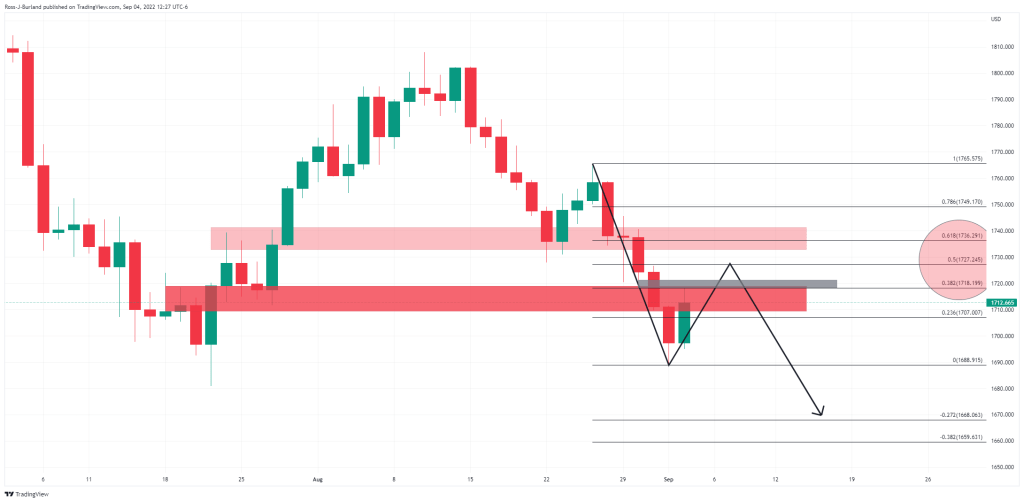
The price is headed towards a price imbalance near $1,721. Beyond that, a 50% average reversal comes in at around $1,727 to the previous build. The bears are devoted to the market here.
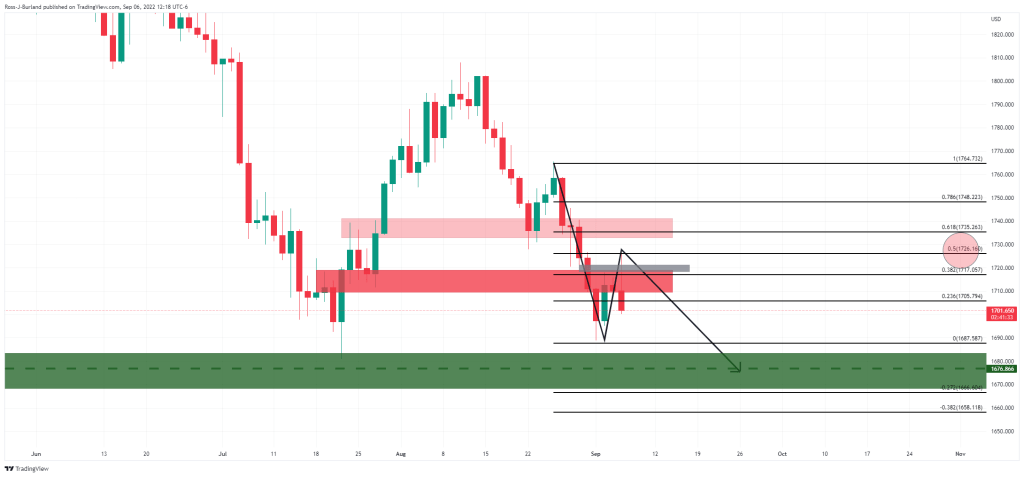
Then we saw a downward movement again. This allows the downside to stretch to retest 2021 lows around $1,676.
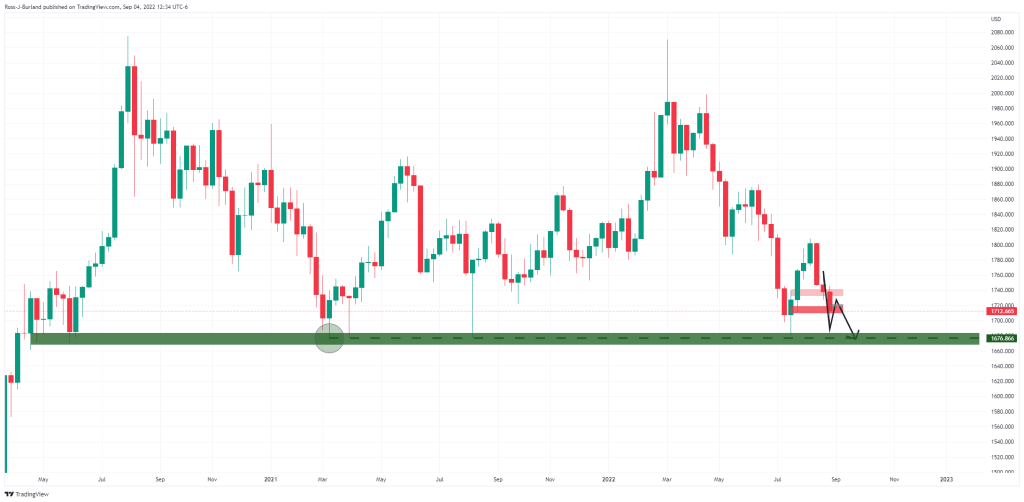
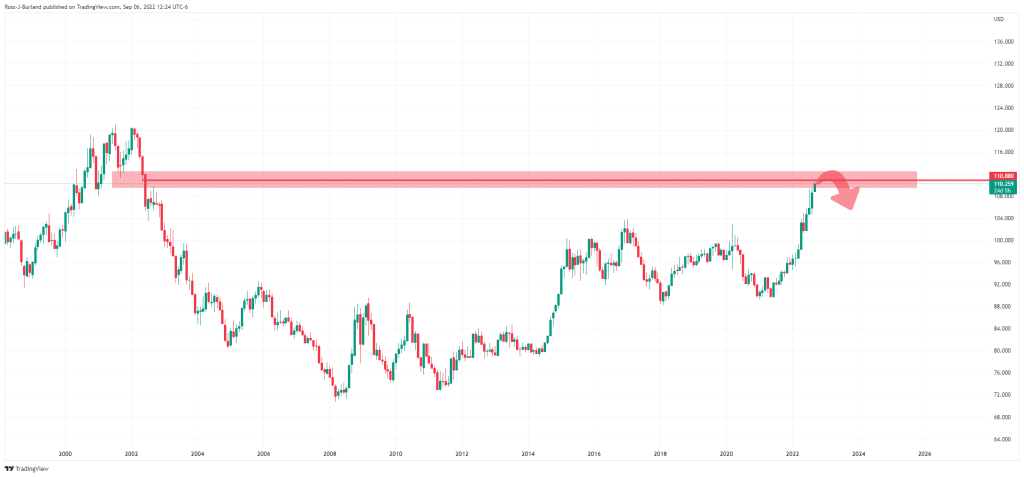
However, the US dollar is likely to struggle at this point, at least in the near future, as it sits at 110.80 weekly.
