Crypto analyst Filip L notes that Chainlink price action has dropped as the markets continue to rally. Also, the Algorand price action is dragging the dollar down as a trendline closes the upside. Analyst John Isige, on the other hand, says the altcoin price is in danger of retreating by 15% as the lost ETH supply hits a 4-month high. We have compiled the analysts’ LINK, ALGO and ETH analyzes for our readers.
“LINK will turn a positive week into a negative week”
cryptocoin.com As you follow, LINK is up over 2% on Tuesday morning. Meanwhile, all stock indices also gained. However, the 55-day Simple Moving Average stuck the wheels of its rally. So it’s not a big deal if the Chainlink deviates a bit. The drop almost retracts all the gains from Monday. Also, another loss is possible for this week.
LINK acts as a canary in the coal mine, alerting traders to general unrest. The real stress test will come at the red descending trend line marked in the chart below. If the price action breaks below the trendline, the bears will have two clear indications that more downside is coming. Therefore, increasing numbers will want to be a part of this sale. On a break below the red descending trendline, a bearish move towards $6.50 is possible. From there, expect it to flirt with the October low at $6.33.
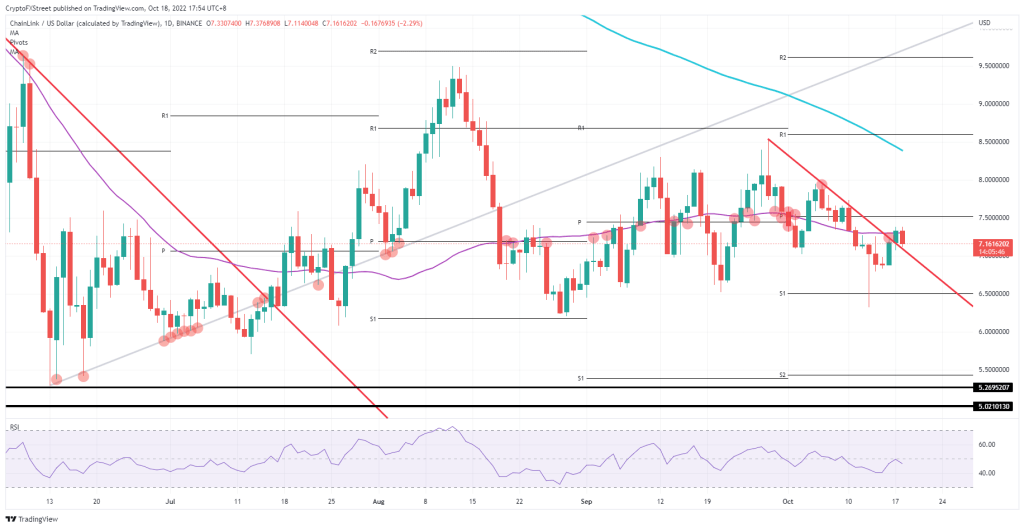 LINK daily chart
Alternatively, in a more bullish scenario, if the altcoin bounces and closes above the red descending trendline before the end of the trading day, the bulls will have a chance to buy again and increase the price action. This will likely mean that today’s high of $7.37 will break up and the price will reach $7.50. After that, if the rally continues towards the weekend, the 200-day SMA will be at $8.50. If stock gains surprise to the upside during the week, more gains are likely.
“10% loss possible in ALGO price”
Algorand price failed to react to bull prices in equities as the Nasdaq led the rise. Stocks had a chance to recover as cryptocurrencies declined in their performance. It must have been painful for crypto traders to see a small slippage. Some majors, such as Bitcoin price action, score higher. But altcoin projects are going almost nowhere.
ALGO had its definitive rejection against $0.33. Thus, the altcoin double-topped Monday’s high and returned to September 28. If the bulls are already struggling with this technical level, do they need to break a monthly pivot or even a move? Expect pressure to build up on the ascending short-term trendline with a breakout near the monthly S1 that potentially sees a bearish on Oct. 13 and tests again at roughly $0.29.
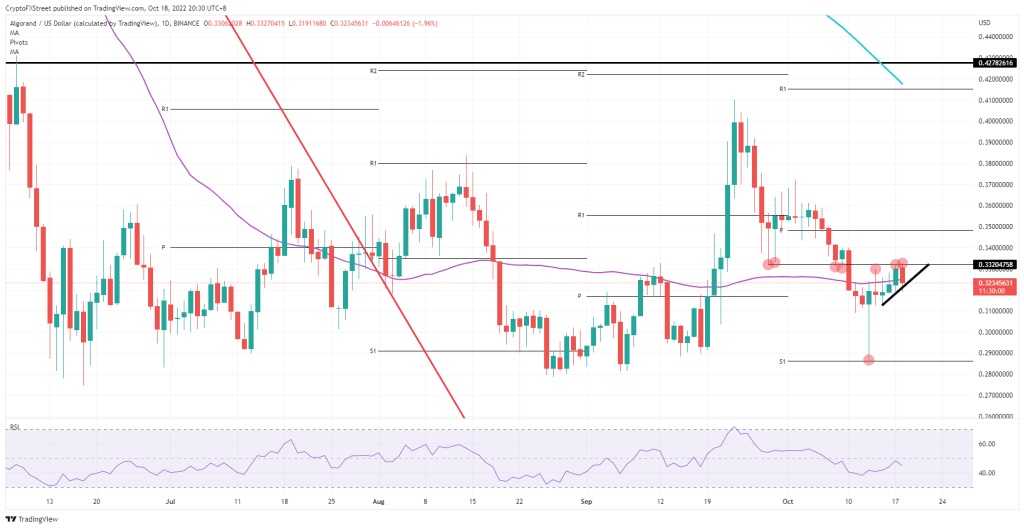 ALGO daily chart
If the stock market indices rise this strongly, it’s possible that the tailwinds for ALGO will increase. In this case, an uptrend is inevitable. This means $0.33 has cleared and price action has bounced back to $0.35 and reached the monthly pivot point. Suppose the current market reversal will be enough for the price to go up. In this case, which is highly unlikely, if another catalyst event occurs with some positive fallout, we’ll likely see an attempt to break $0.37 to the upside.
“Leading altcoin risks falling 15% below breakout point”
If confirmed, it is possible that the falling triangle pattern on the eight-hour chart could lead to a 15.22% drop in ETH. However, considering the support at the 50-day SMA, this verification will not be easy. The RSI (Relative Strength Index) shows that sellers are fighting to regain control. But the bulls are determined. Traders looking for a short position should wait for ETH to drop below the moving average before triggering their orders.
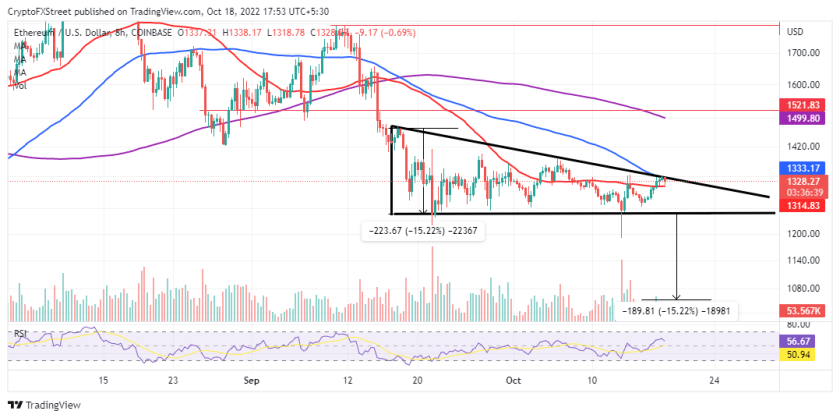 ETH eight hour chart
On the other hand, the 15.22% triangle breakout price target will only be activated if Ethereum price breaks below the horizontal (x-axis) support at $1,250. However, such a move is possible for ETH to revisit the downhill levels at $1,057 and $1,000, respectively, before returning the floor to $2,000.
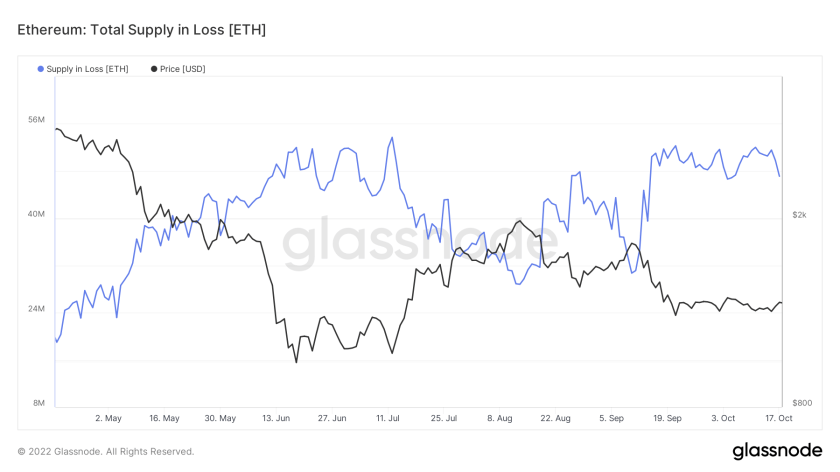 Ethereum supply at a loss
The total supply of ETH at loss has increased from 30 million recorded on Sept. 30 to nearly 52 million. According to Glassnode, this on-chain metric tracks the number of tokens whose price was higher than the current price when they last moved. As seen from the chart, Ethereum price is negatively correlated with the aggregate supply at a loss. In other words, the Ethereum price goes down as the supply at the loss increases. Therefore, if this on-chain metric extends the ongoing pullback from the four-month high, a bullish move is likely in store for ETH.