RDNT has strong upside potential in the coming days, according to crypto analyst David. Analyst Best Owie points to the rise of liquid staking coins like LDO and RPL. ‘The Bull! Nicknamed analyst Tony, on the other hand, says that an altcoin project is ready to boost the market. Analyst Ell Dambel is hopeful of popular meme coin Shiba Inu. Santiment points to the increase in social dominance in XRP.
This altcoin can rise strong!
Radiant Capital (RDNT) price has been trading in the range of $0.315-0.50 since March 16, 2023. The price tested both the support and resistance of this range multiple times. On May 11, this range was resolved to the downside. This showed that the bears had taken control of the market. However, they could not take advantage of it to lower the price. Indeed, the price formed a triple bottom formation at $0.290. Thus, it is currently in the process of reclaiming the support of the previous range. If successful, a strong upside move is possible due to a short squeeze.
The triple bottom pattern is usually a bullish pattern that leads to an uptrend reversal. Therefore, there is a possibility that RDNT price could retake the support of the range and quickly rally to the nearest resistance level of $0.365. The RSI indicator supports this possibility as it broke above the descending resistance line and retraced the 50 level.
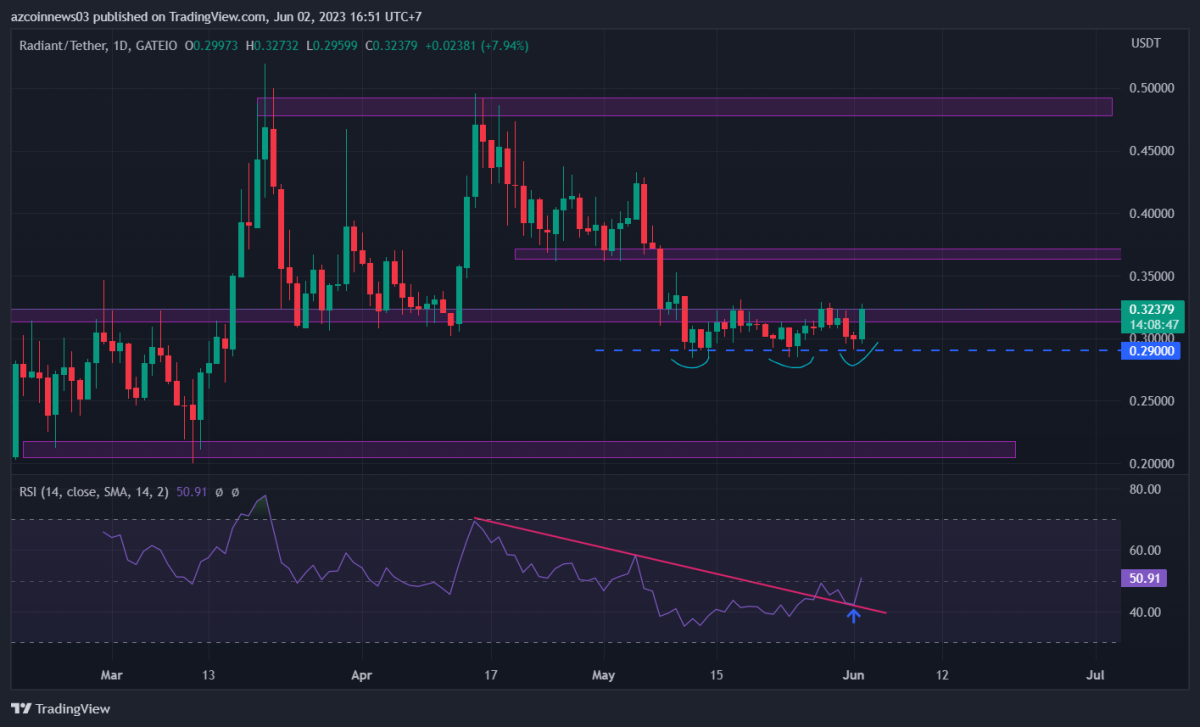 RDNT daily chart / Source TradingView
The most likely scenario shows that RDNT price will retrace the support of the previous range and quickly rally to $0.365 and potentially $0.50. However, this perspective is invalidated if the price dips below the $0.290 level.
LSD tokens benefit from volatility
As the total amount of ETH invested in the Ethereum network has increased, so has the value of LSD tokens. Coins like Lido Finance (LDO) and Rocket Pool (RPL) have also been on the rise over the past day. The latter emerged as the top 3 winnings with almost 10% gains in the last 24 hours. cryptocoin.com As you can follow from , Lido’s market share in the liquid staking market has also increased. Because the protocol currently accounts for 37.85% of all ETH staked in liquid derivatives protocols. Coinbase is the second largest with 11.88% of the market share, while Rocket Pool accounts for 7.72% of the market share.
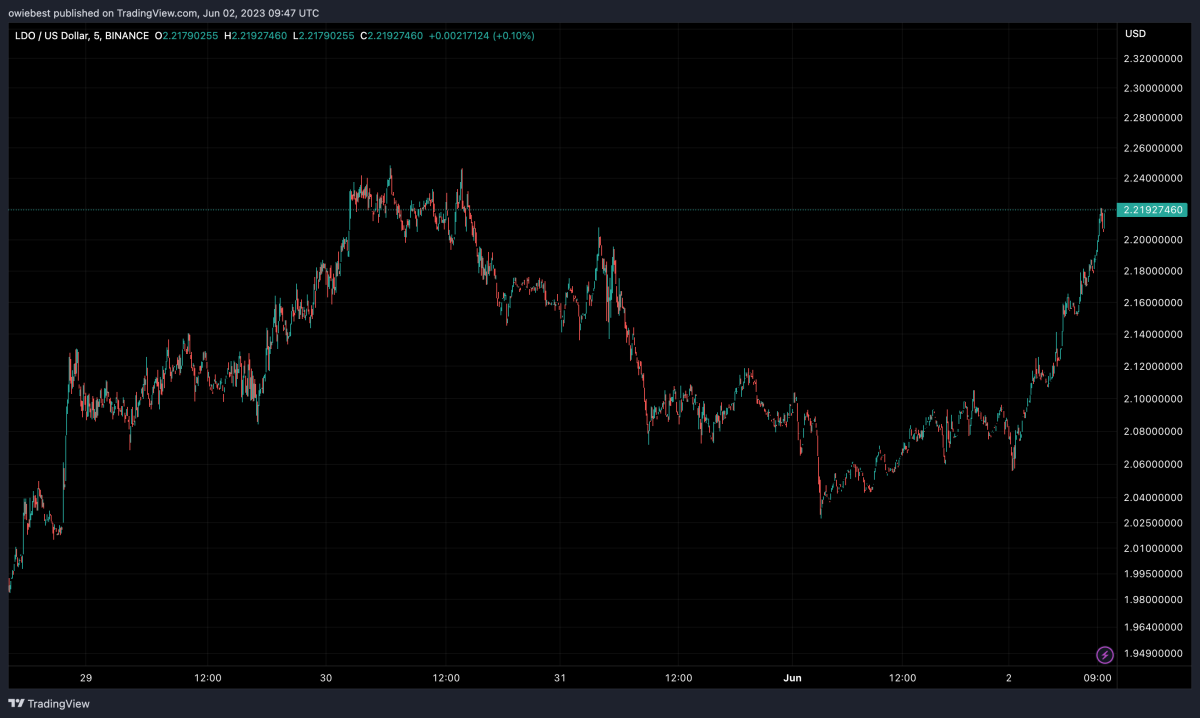 LDO price up 10% in 24 hours / Source: TradingView
Other LSD tokens also turned green on the last day. pSTAKE Finance’s PSTAKE rose 3% and StakeWise’s SWISE nearly 4% in the same time frame.
This altcoin is ready to fire up the crypto market!
In early 2019, LTC would often lead Bitcoin rallies. If Litecoin is rising, you can be sure that BTC will follow. At no point was this more evident than in Litecoin’s halving. This halving was almost a year before his big brother’s halving. LTC outperformed BTC by roughly two-to-one.
However, Litcoin has since fallen out of favor and fell out of the top ten by market cap. It was characterized as a major failure during the bull market of 2020 and 2021, where it failed to reach an all-time high. At the time, it offered little compared to the layer 2s buzzed with NFTs and DeFi on their backs. When we come to today, we are just before Litecoin’s halving. This time, the coin has an interesting fundamental support that it hasn’t had in the past. First, the LTC-20 allows smart contracts and NFTs on Litecoin. In addition, the fact that it is a faster and cheaper alternative to BTC and ETH has seen a significant increase in network transactions. All that remains for a major move in silver to Bitcoin as digital gold is a technical break in the combination of fundamental strength. And that may be just minutes away.
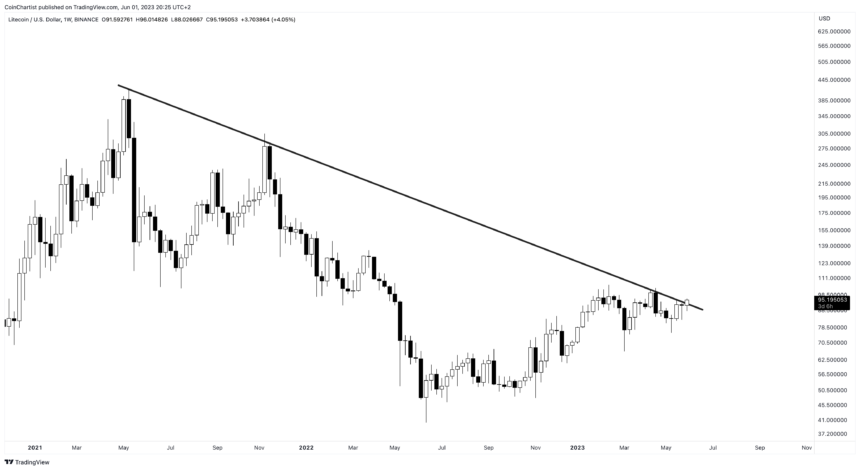 Is this a valid break of the downtrend line? | Source: TradingView
LTC/BTC and LTC/ETH charts also seem to support a change in the tides among these top crypto giants. Once Litecoin breaks out of a long downtrend line, it usually doesn’t stop climbing for months. A rally of 9,000% and 600% has been seen in the past. What can this trendline breakout bring as a result? If the once forgotten altcoin starts to climb, it could push the entire crypto market up. Thus, it is possible for him to rekindle his bull run. This, in turn, is likely to help LTC regain its place among the top ten cryptos by market cap.
SHIB price prediction
SHIB is trading in a downtrend today. It is also forming the fourth consecutive red candle on the daily chart while forming lower lows. It is trading below its 50-day and 200-day Simple Moving Averages (SMA), which is a short- and long-term bearish divergence. Also, the Relative Strength Index (RSI) is hovering near the oversold zone of 30 at 35.64. This confirms the bearish trend as the indicator moves downwards.
The Moving Average Convergence/Divergence (MACD) of the SHIB is above the signal line. However, it shows a negative value. Also, histogram bars are decreasing, indicating a bearish trend. These indicators suggest that SHIB will likely continue in a downtrend until the bulls rise again. SHIB is approaching the 38.2% Fibonacci level ($0.00000839), which is the closest support level.
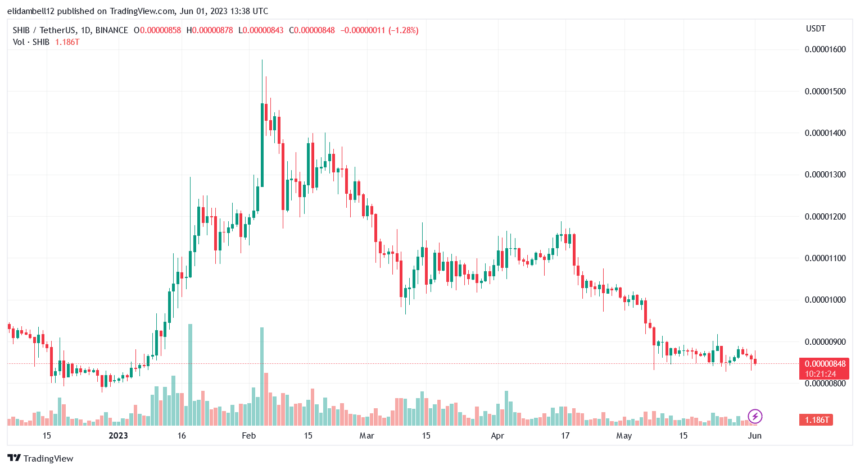 SHIB falls on daily candle / Source: TradingView
Let’s hope SHIB does not fall below this support level. If this happens, a rise to the 23.6% Fib level ($0.00000869), which is the nearest resistance level, is possible. If it rises above the $0.00000869 resistance, it will signal a recovery for SHIB.
XRP social dominance is on the rise, what does that mean?
Crowd optimism around XRP has increased recently, according to data from on-chain analytics firm Santiment. A relevant indicator here is “social volume,” which measures the total number of unique social media text documents currently mentioning a particular cryptocurrency or topic. Since this metric only measures the unique number of such documents, it means that even if the cryptocurrency in question is mentioned several times in a post, its share in social volume will remain by only one unit. Because of this restriction, the indicator provides a reliable picture of whether users across the broader social media platforms are currently discussing the asset.
Another indicator called “social dominance” is also of interest here. This metric compares cryptocurrency social media to the combined social volume of the top 100 assets by market cap in the industry. Now here is a chart showing the trend in XRP social volume and social dominance over the past year:
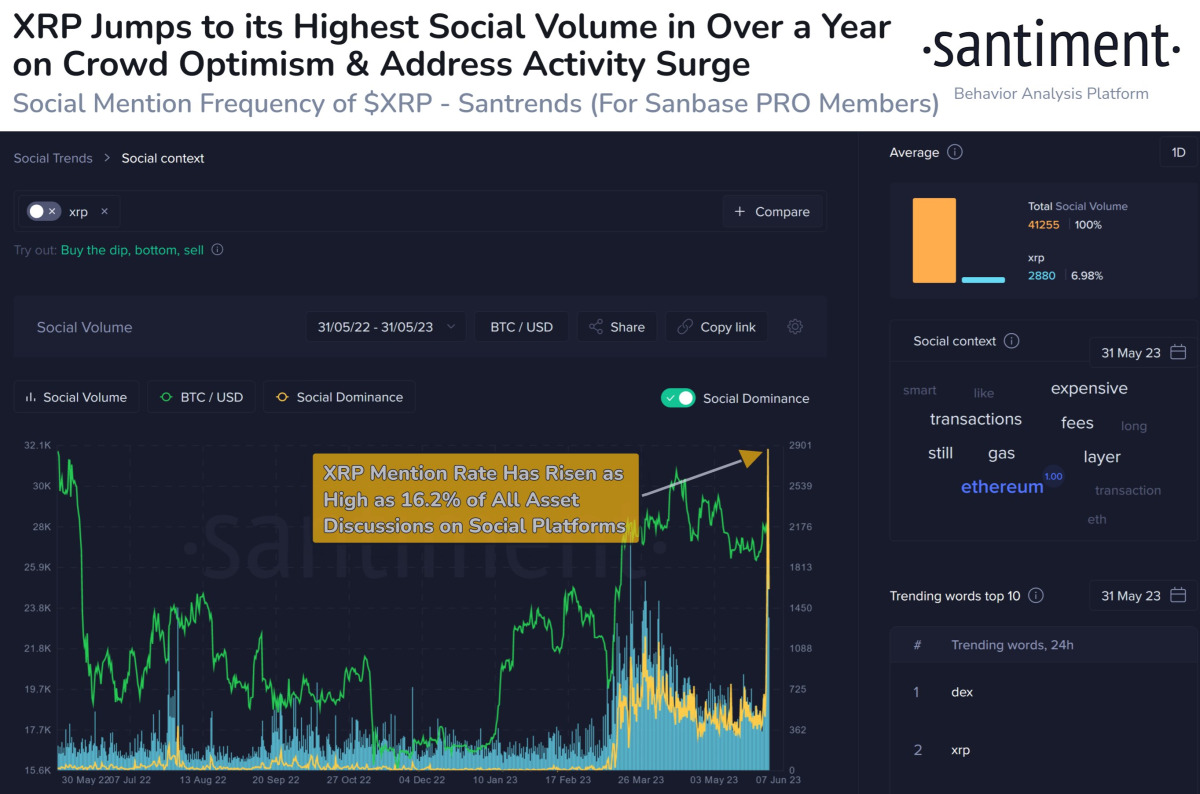 These two metrics have been very high in recent days / Source: Santiment
As the chart above shows, both XRP social volume and social dominance have skyrocketed recently. At the peak of this fluctuation, the second indicator reached a value of 16.2%. This means that 16.2% of all discussions on social media websites about the top 100 assets are about altcoins.
The recent surge in XRP’s social dominance isn’t necessarily bearish. But it’s still something that will increase the likelihood of a peak happening. However, the number of active addresses is growing rapidly. So there has also been a bullish sign for the asset lately. Such a trend is usually a sign that a large number of users are joining the Blockchain. This is a situation that will support the rise of the altcoin price.


