April started with a bullish run for the cryptocurrency market. However, the sharp decline that began on April 14 led several cryptocurrencies to lose all their gains. Crypto analyst Valdrin Tahiri examines 4 altcoin projects that have been hit particularly hard. According to the analyst, the formations of altcoins indicate further declines in May.
MATIC lost critical support
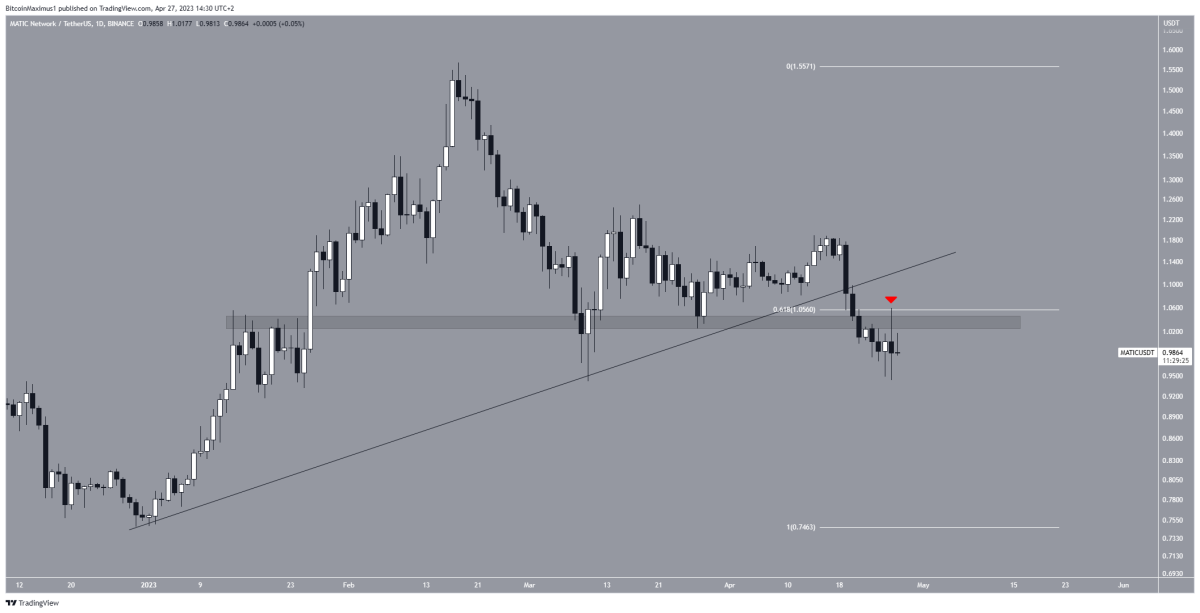
Polygon (MATIC) price broke down from an ascending support line on April 19. This line had previously shaped the slope of the increase since the beginning of the year. All in all, this breakout marks the completion of the upside move and the start of a new downside move. Moreover, the price lost the critical Fib at $1.05 and the horizontal support level. According to the principle of Fibonacci retracement levels, after a significant price change in one direction, the price is expected to partially retrace or return to a previous price level before continuing in its original direction. Also, these levels can be used to identify the peak of future upward moves.
 MATIC daily chart / Source: TradingView
After the altcoin turned bearish, it confirmed the $1.05 level as resistance (red icon). This supports the possibility that more downside moves are expected before the price bottoms out. With the lack of support below the current price, MATIC is likely to drop as low as $0.74, the year low. A close above $1.05 invalidates this bearish forecast. In this case, it is possible for MATIC to reach the previous ascending support line at $1.20. However, the bearish momentum indicates that more downside can be expected at the moment.
The price of this altcoin plunges to the bottom of the new year
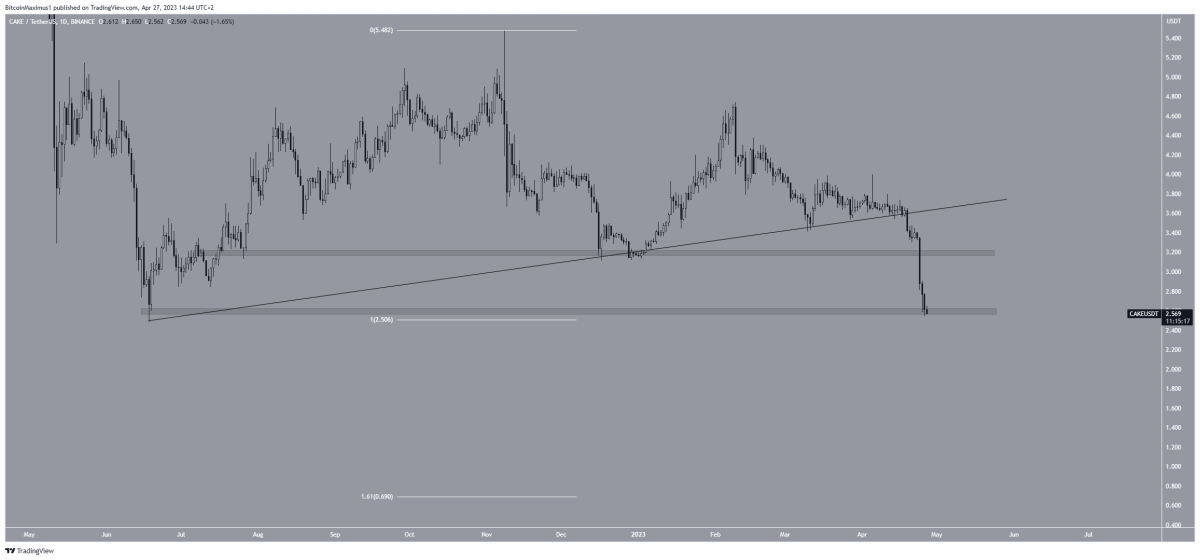
PancakSwap (CAKE) price broke down from an ascending support line on April 19. The altcoin has since plummeted. The fall was rapid and did not allow a splash mark. CAKE price has reached its lowest level of the year at $2.57. Also, there is a risk of more breakouts from the $2.55 horizontal support area. If it breaks, it will fall below the 2022 low. With no support below the current price, it is possible for this to cause a sharp drop to $0.70.
 CAKE daily chart / Source: TradingView
However, if the altcoin bounces, it could now rally towards the $3.20 area, which is expected to provide resistance.
KISS price risks breaking out of bearish pattern
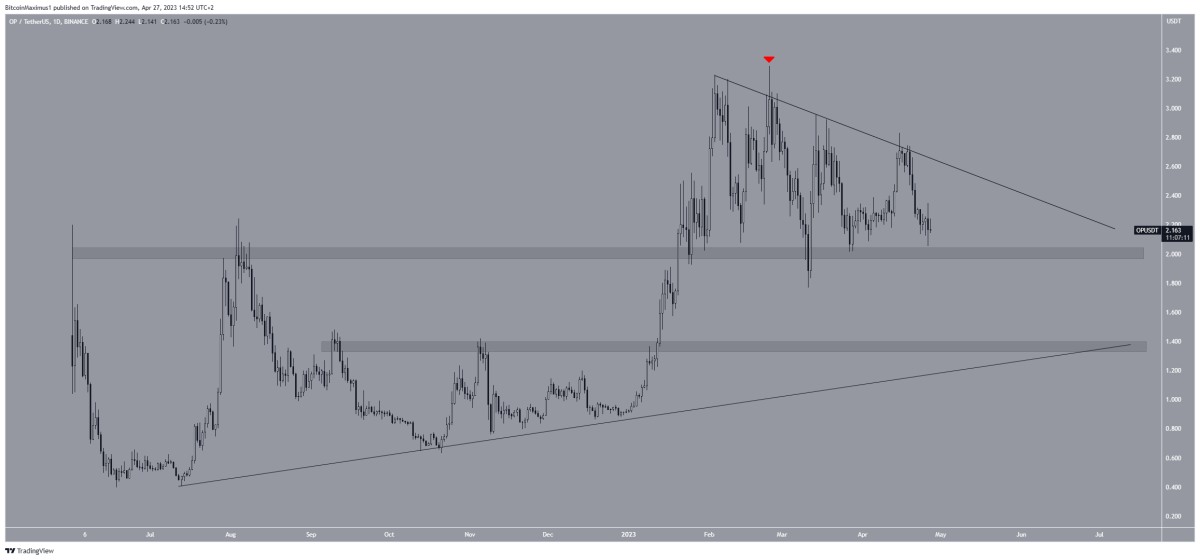
Optimism (OP) price has fallen below a descending resistance line since early February. Alongside the line, the price also reacted to the $2.0 horizontal support area. When combined, they form an descending triangle, which is considered a bearish pattern. This means that the formation often leads to malfunctions.
 OP daily chart / Source: TradingView
If a breakdown occurs, the OP price could drop to the next nearest support at $1.30. The support forms a horizontal support area and an ascending support line. On the other hand, if the bearish altcoin manages to bounce off the $2.0 area, a rise towards the descending resistance line at $2.25 is possible.
This altcoin price drops after corrective structure
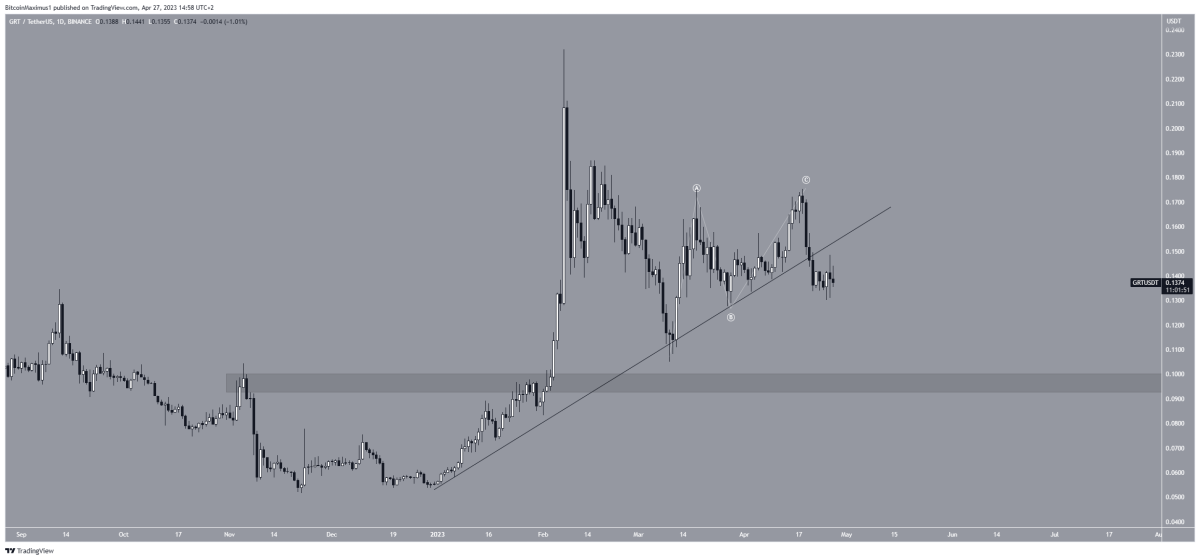
cryptocoin.com As you can follow, The Graph (GRT) started an upward movement on March 10. However, it could not sustain it and reversed the trend on April 21. The decline resulted in a breakout from an ascending support line. This indicates that the upward move is complete. Moreover, the previous increase is very similar to an ABC retracement structure. Technical analysts using Elliott Wave theory study recurring long-term price patterns and investor psychology to determine the direction of a trend. Since the correction is on the upside, it means the trend is down.
 GRT daily chart / Source: TradingView
If the drop continues, the bearish altcoin is likely to drop as low as $0.095, the next closest support area. This bearish prediction will be invalidated if it regains the ascending support line. Thus, it could lead to an increase towards $0.22.


