Bitcoin finished the week with a sharp drop of about 9 percent. This indicates that some traders may be booking their profits for fear of a resumption of the downtrend. Analysts expect Bitcoin to reach the $26,600-25,000 region, where buying interest may increase. Meanwhile, analyst Rakesh Upadhyay explains that he expects drops for four altcoins. Here are the analyst’s expectations for the four popular altcoins, BNB, ADA, XMR, and TON.
Bitcoin price analysis before altcoin projects: What’s next?
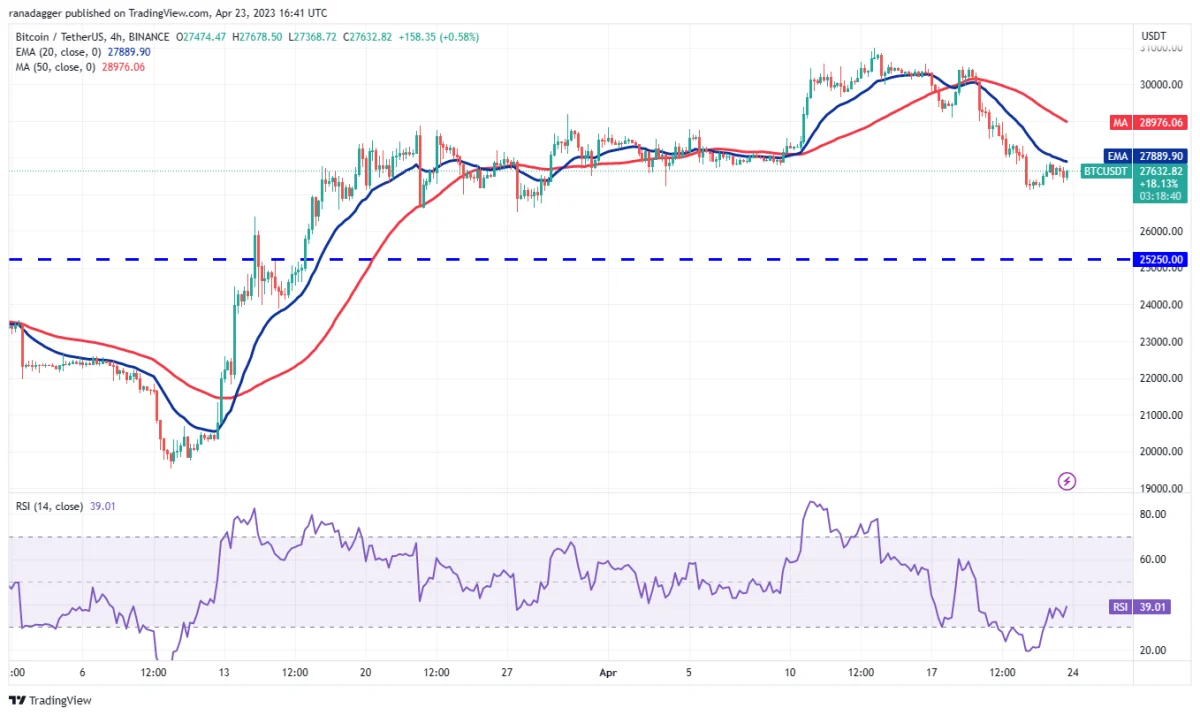
Buyers are trying to stop Bitcoin’s correction at the 50-day simple moving average (SMA-$26,983), but the shallow movement shows that the bears are not willing to give up. The 20-day exponential moving average (EMA-$28,606) has started to turn down and the relative strength index (RSI) is in the negative territory, signaling that the bears have a slight advantage. If the 50-day SMA is broken, the selling could increase even more. The BTC/USDT pair could then decline as low as the $25,250 breakout level. This is an important level to consider because if this support breaks down, the pair could drop to $20,000.
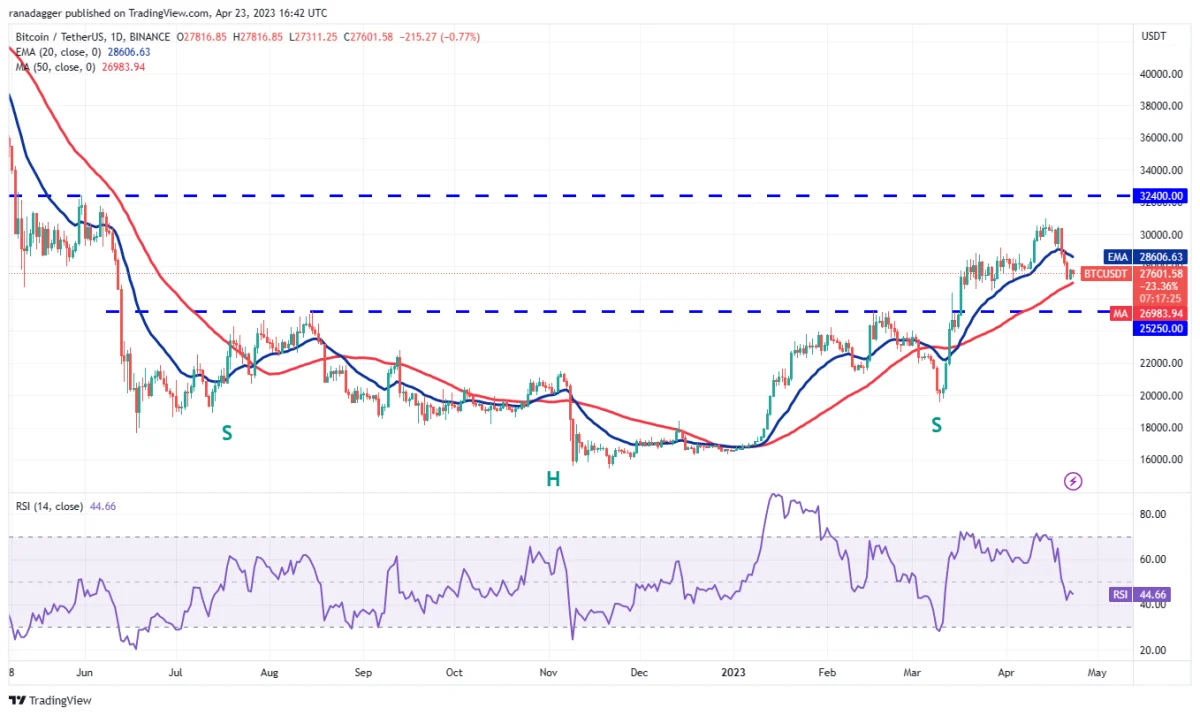
Buyers will need to push and sustain the price above the 20-day EMA to signal a reversal. This could attract buying and push the price towards the $31,000-32,500 resistance zone. The pair bounced off $27,125 and reached the 20-day EMA. This is the first hurdle the bulls must cross to start a strong recovery. The pair could then reach the 50-day SMA, where the bears will try to put up a strong defense again. If the price turns down from the current level and dips below $27,125, it will indicate that sentiment remains negative and traders are selling on every minor rally. This would increase the possibility of a drop to $26,500 and eventually to $25,250.
Battle between bears and bulls over Binance’s altcoin project BNB
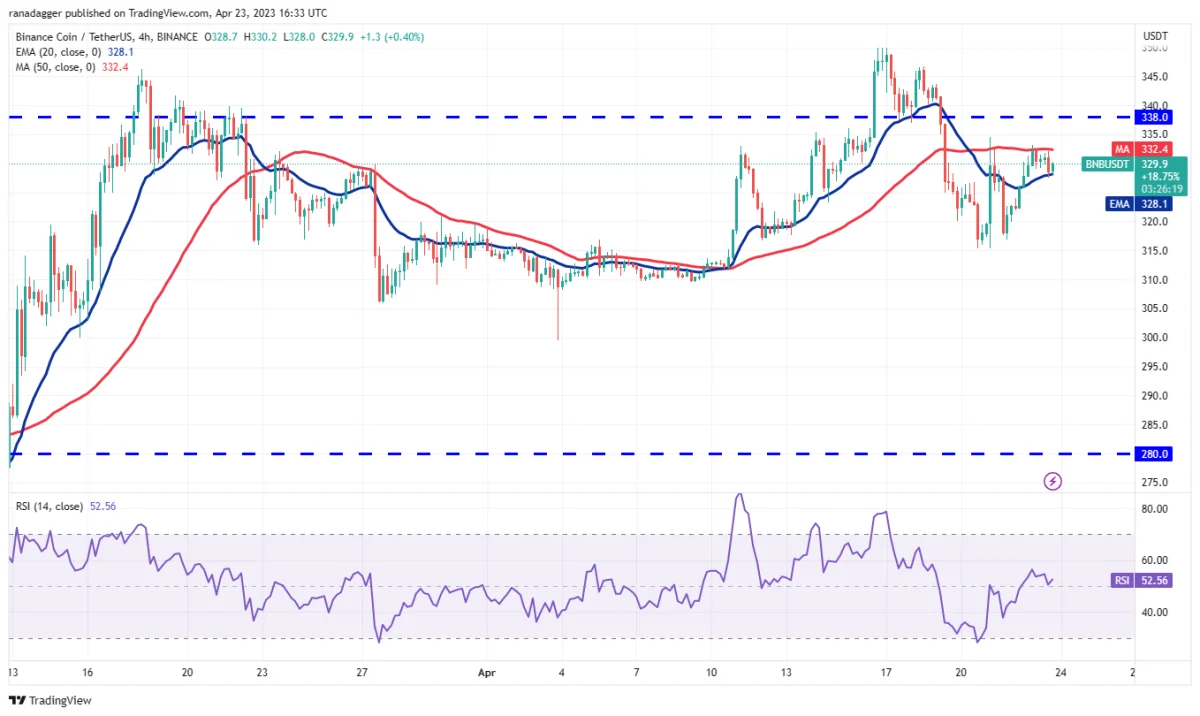
BNB is witnessing a tough battle between bulls and bears. While the sellers are active above $338, the bulls are fiercely defending the 50-day SMA ($316). The BNB/USDT pair recovered from the 50-day SMA on April 21 and the bulls are trying to break through the $338 hurdle. If they are successful, it will increase the likelihood of a rally above $346. The pair could rally towards $400 later. The slowly rising 20-day EMA ($325) and the RSI in the positive zone suggest that the bulls have a slight advantage.
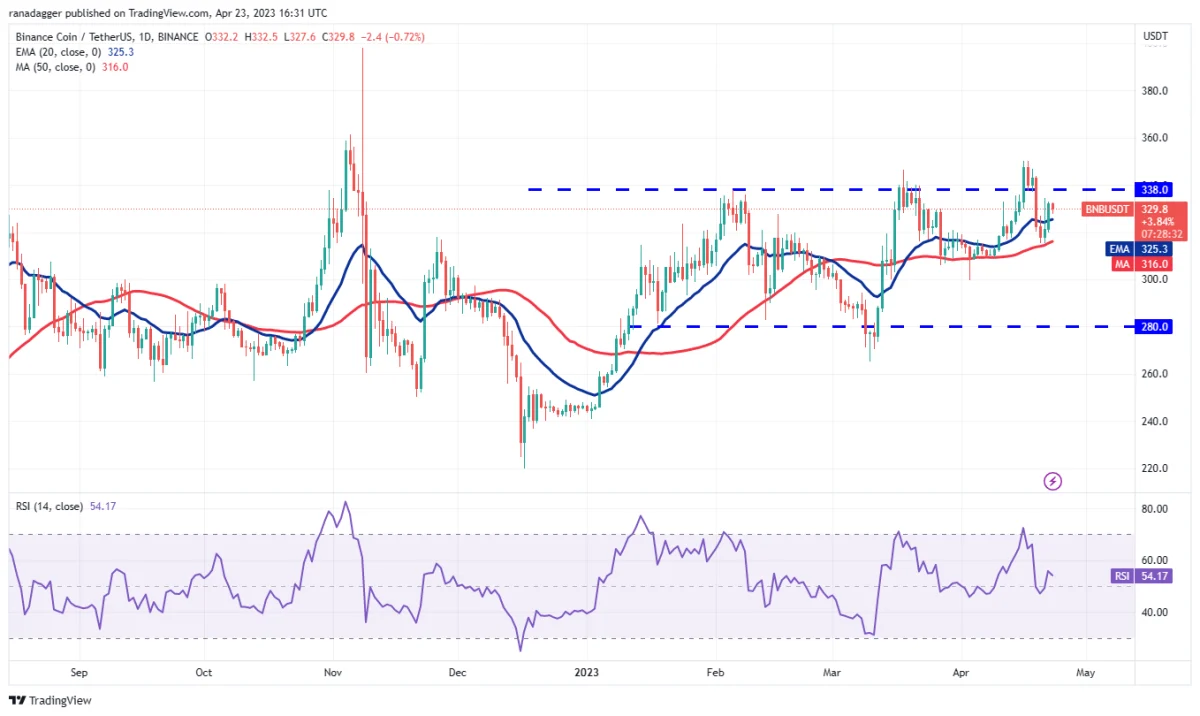
If the bears want to prevent an up move, they will have to push the price below the 50-day SMA. This, in turn, could accelerate selling and bring the pair down to $300 and then to $280. The four-hour chart shows the price recovering from the support near $316 and reaching the 50-SMA. If the bulls clear this hurdle, the pair will attempt to climb higher to $338 and then $346. A break above this level could witness a rebound in bullish momentum. According to the analyst, the first support to watch on the downside is the 20-day EMA. If this support gives way, it will show that the pair could consolidate between $315 and $335 for a while.
Cardano price analysis: ADA turned bearish
cryptocoin.com As we have reported, ADA, the coin of the Cardano network, turned down and fell below the neckline of the inverted head and shoulders (H&S) pattern on April 20. This indicates that the bears are trying to trap the aggressive bulls. A minor positive point in favor of buyers is that they are trying to maintain the 50-day SMA ($0.37). The 20-day EMA ($0.40) has turned down and the RSI is just below the midpoint, suggesting that sellers are trying to take control. If the price drops below the 50-day SMA, it will indicate that the bears are in the driver’s seat. In this case, the ADA/USDT pair could drop as low as $0.30.
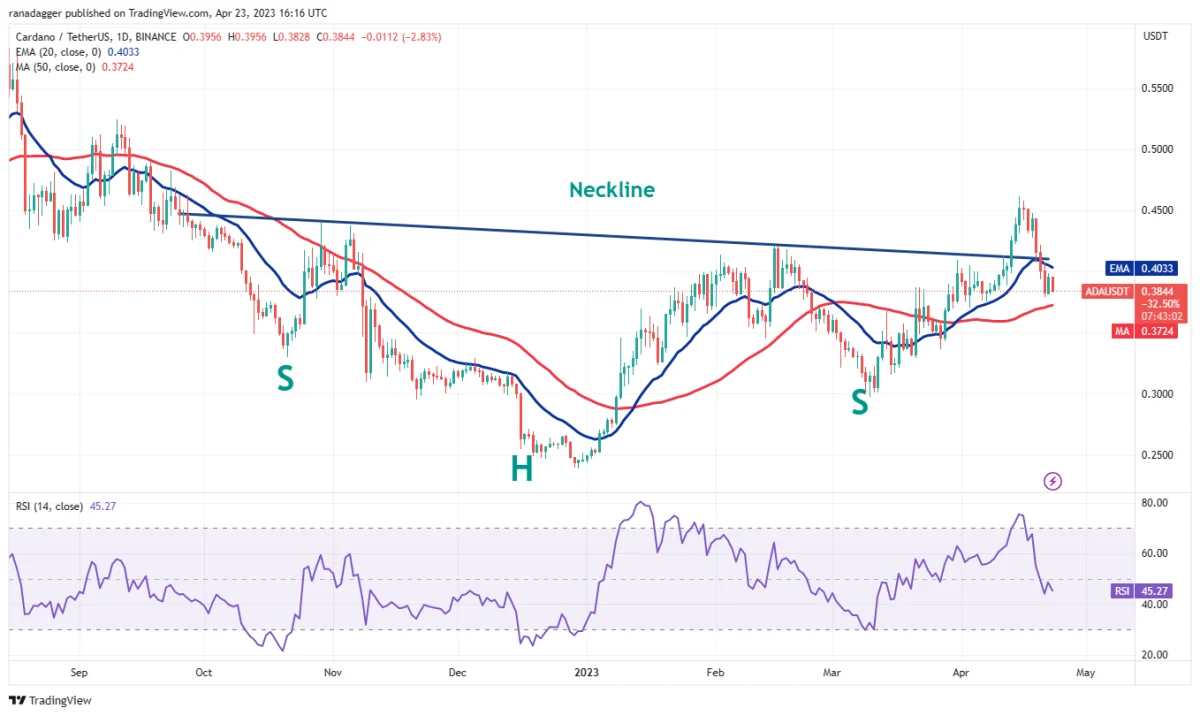
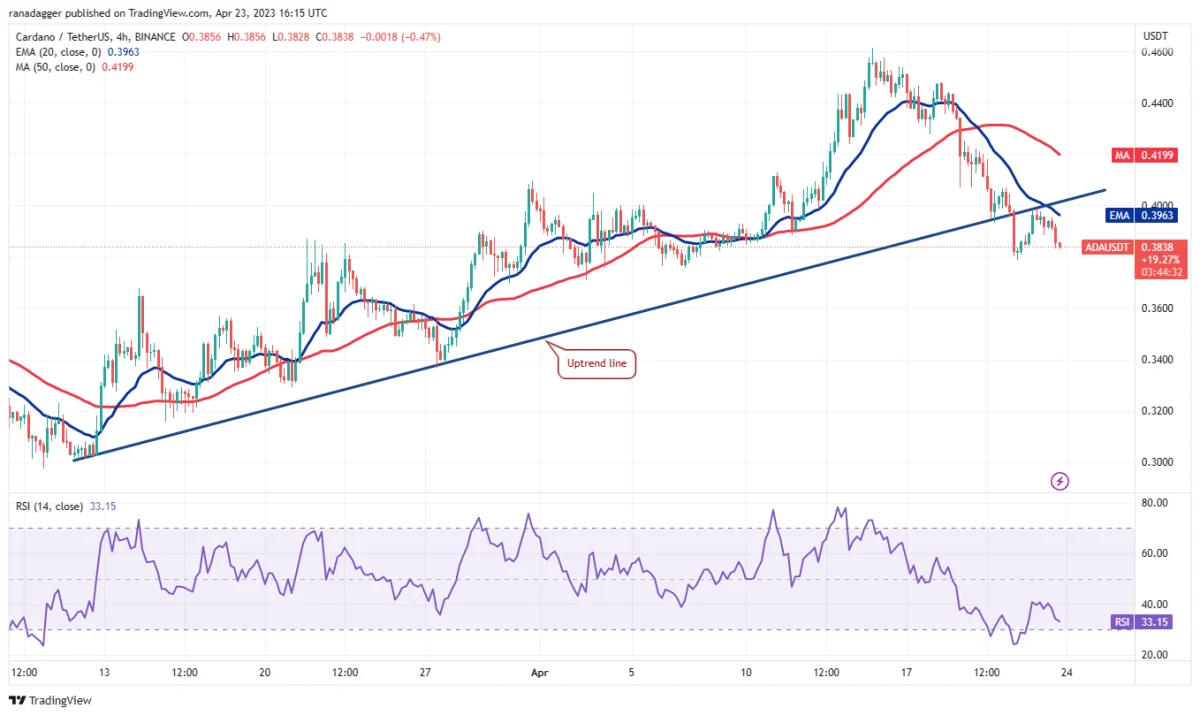
Conversely, if buyers want to maintain their edge, they will need to quickly push the price back above the neckline. If they manage to do so, the pair could witness a solid buy. The pair could rally to $0.46 later. The four-hour chart shows that the bears pulled the price below the uptrend line and attempted to turn the level into resistance on a retest. The falling 20-EMA and the RSI in the negative zone suggest that the bears have the upper hand. If the price dips below $0.38, selling could intensify and the pair could drop as low as $0.34.
Monero price analysis: sharp rebound for altcoin?
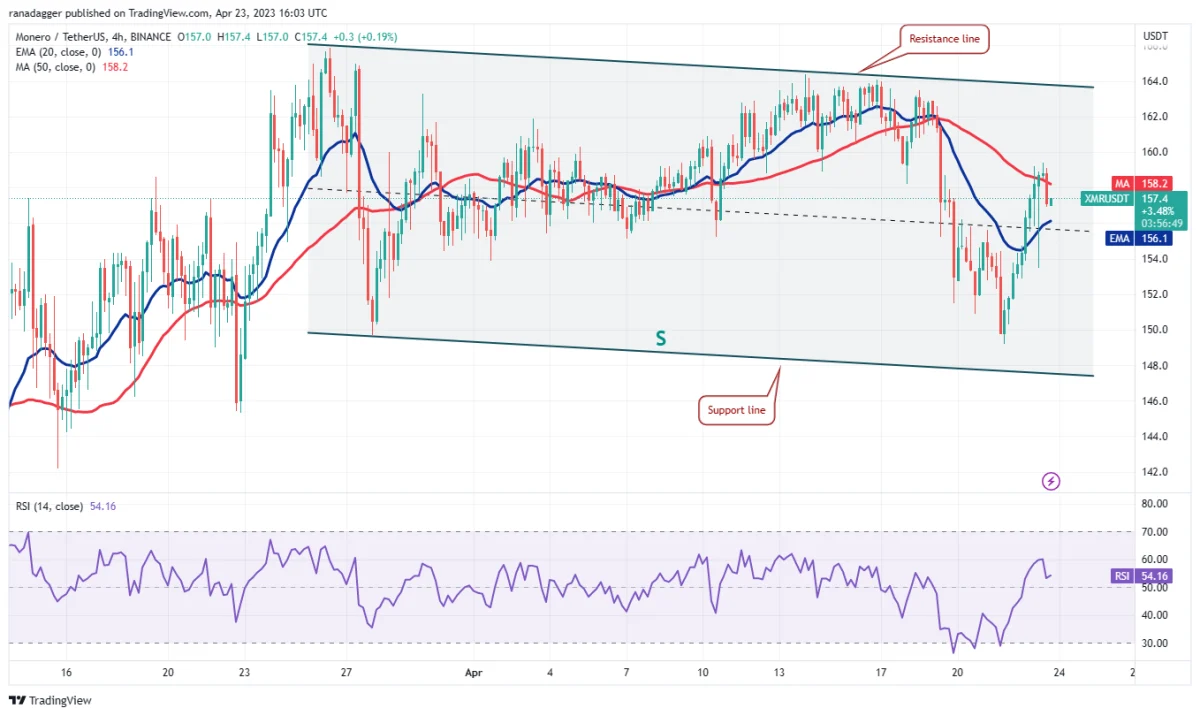
Altcoin Monero, on the other hand, has turned down from the neckline of the evolving inverse H&S pattern, but the sharp recovery from the lower highs points to aggressive buying on the dips. Buyers pushed the price above the 20-day EMA ($157) and will try to push the neckline again. If this level scales, it will complete the bullish setup and pave the way for a potential rise to $185 and then the $199 pattern target.
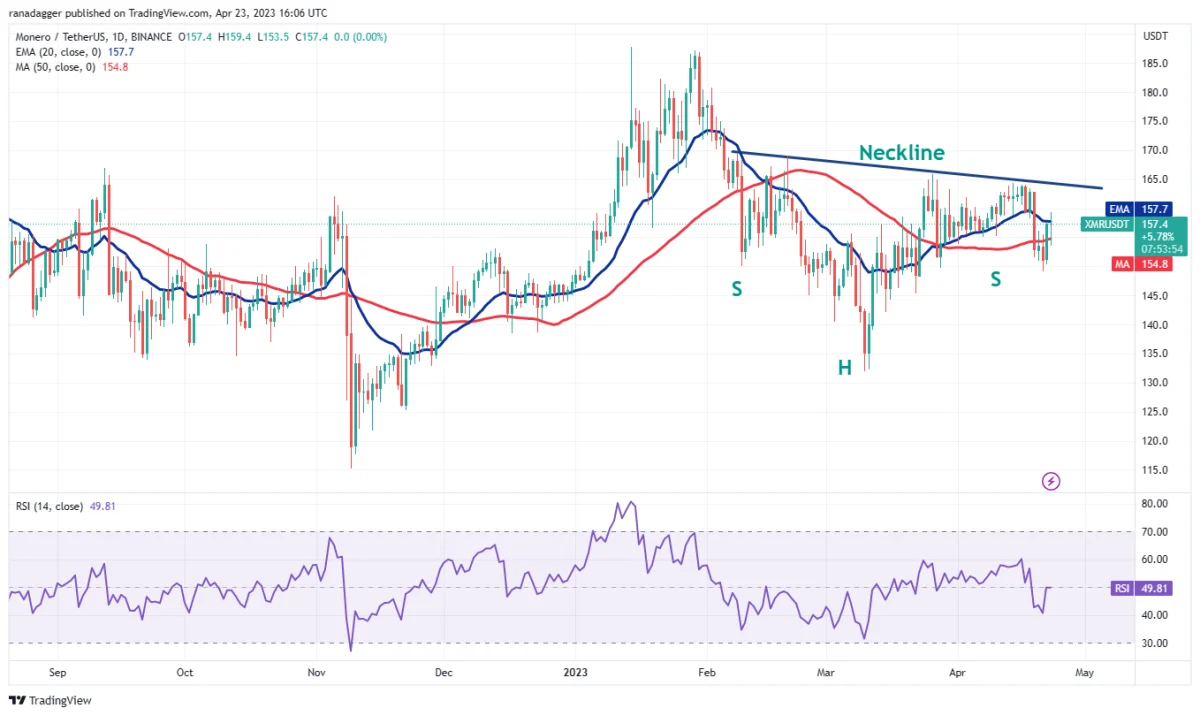
According to the analyst, if the price turns below the current level or neckline, it will indicate that the bears are selling in the rallies. A break and close below $149 will signal that the bears are taking control. The XMR/USDT pair could decline further to $145 and then to $140. The pair is trading inside a descending channel formation on the four-hour chart. The rebound from the support line of the channel indicates solid buying at the lower levels. If the buyers hold the price above the 50-SMA, the pair could rally to the resistance line of the channel.
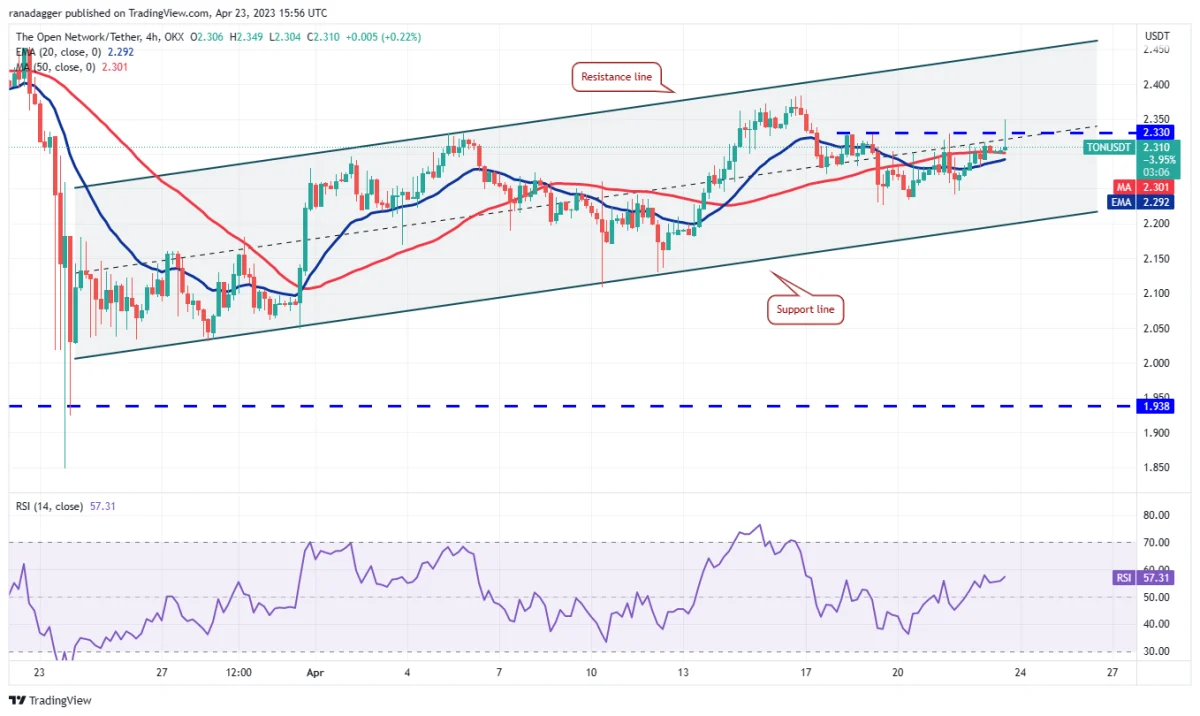
Toncoin price analysis: TON near resistance line
Toncoin (TON) has formed a descending bearish triangle, but a positive sign in favor of buyers is that the price has been trading close to the resistance line of the triangle for the past few days. The bulls will try to push and sustain the price above the resistance line, which will invalidate the bearish pattern. Breaking a negative pattern usually results in an upward move as aggressive traders who may have taken a short position in anticipation of a decline close their positions. In addition, bull traders who are on the sidelines due to the negative pattern also start buying.
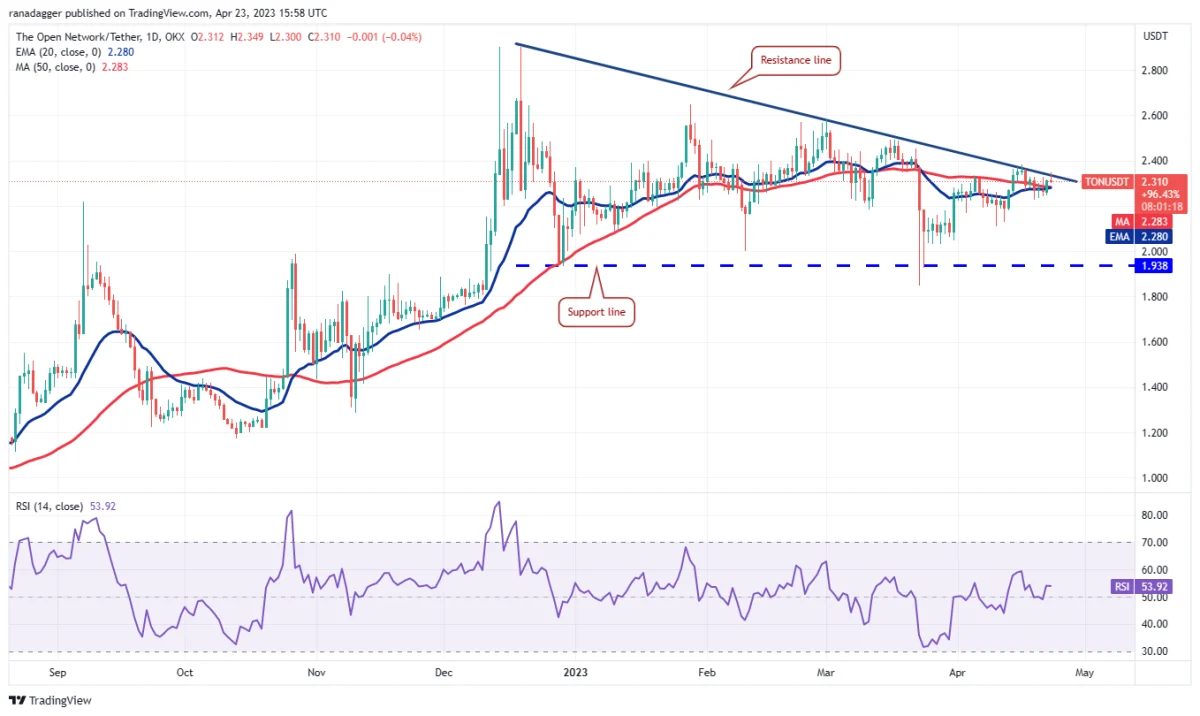
Above the resistance line, the TON/USDT pair could rally to $2.64 and then $2.90. This positive view will be invalidated in the near term if the altcoin price declines and slides below $2.20. The four-hour chart shows the pair rising inside an ascending channel pattern. In the near term, the bears are trying to protect the $2.33 level, but the bulls continue to fiercely attack this level. If the $2.33 level gives way, the pair could start its journey towards the resistance line of the channel around $2.45. Alternatively, if the price breaks down from $2.33 once again, the bears will attempt to push the pair down to the support line of the channel.