The Luna Classic price action is at a point where it suggests a bullish possibility in the near-term, putting it among the binance altcoins to rise. cryptocoin.comWe have compiled these altcoins, which are likely to rise, for you.
Terra Luna Classic price will explode
Binance altcoin Luna Classic price formed a 31% range between $0.000146 and $0.000193 in late November 2022. This range is where the altcoin is still trading, with one divergence below the low range and the other above the high range. These divergences were perfect places to open range-bound trades. Currently, Luna Classic price is trading below the midpoint of this range at $0.000170, but above the $0.000138-$0.000152 demand zone formed on the daily timeframe.
A bounce from this level could provide the LUNC bulls with the necessary strength to start their rise. However, for the uptrend to start on a good note, traders need to wait for the midpoint of the range at $0.000170. A daily candle close above this level will be the first confirmation. Beyond this level, Luna Classic price will target the high range of $0.000193.
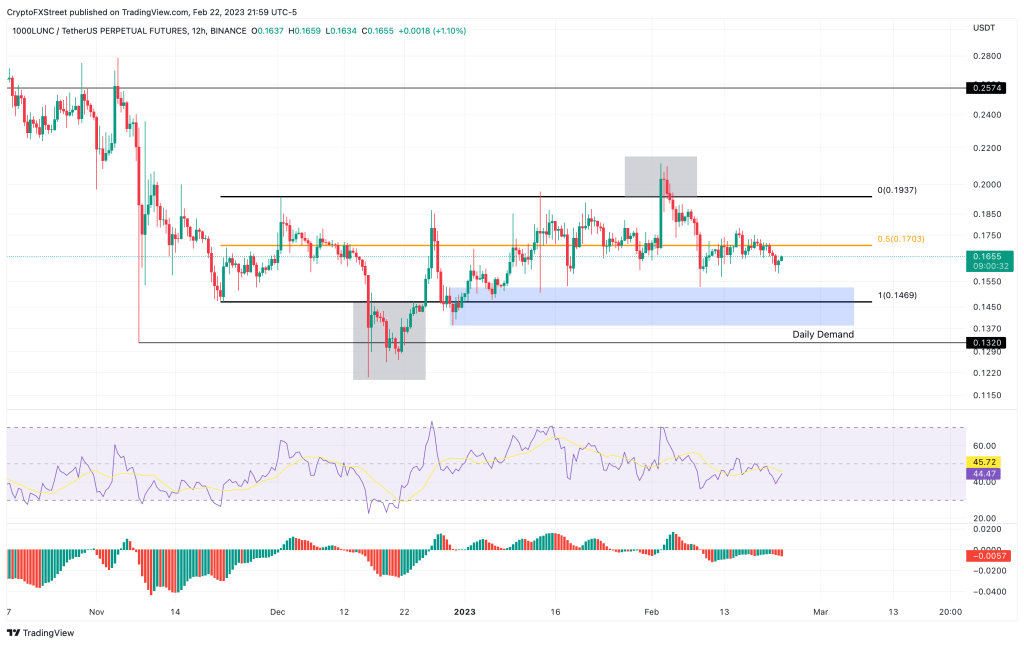
If the bulls can overcome the high range and turn it into a foothold, LUNC could target the $0.000257 resistance level, which is roughly 50% from the mid-range of the range. While the bullish outlook for the Luna Classic price seems reasonable, making a move before it is confirmed would be risky for the players involved. If LUNC fails to break above the $0.000170 level, it means weakness among the participants.
In such a case, if Luna Classic price produces a daily candlestick below the lower limit of the daily demand zone at $0.000138, it will create a lower low and invalidate the bullish thesis for Binance altcoin LUNC. This will be the final nail in the buyers’ coffin, and potentially a quick 5% correction to $0.000132 or to $0.000120 on Dec. 16.
This Binance altcoin rose in response to Google Cloud’s partnership announcement
This Binance altcoin Tezos, an open-source blockchain that handles peer-to-peer transactions, has received a huge boost from its partnership with Google Cloud. The tech giant has joined Tezos as a ‘baker’, a validator that helps set up nodes to verify and secure transactions on the XTZ network using Google Cloud.
Google Cloud has similarly partnered with Aptos and Solana to join these networks as a block-generating validator. Tezos price accelerated to $1.44 to break the key resistance at $1.50 in response to Google’s partnership news.
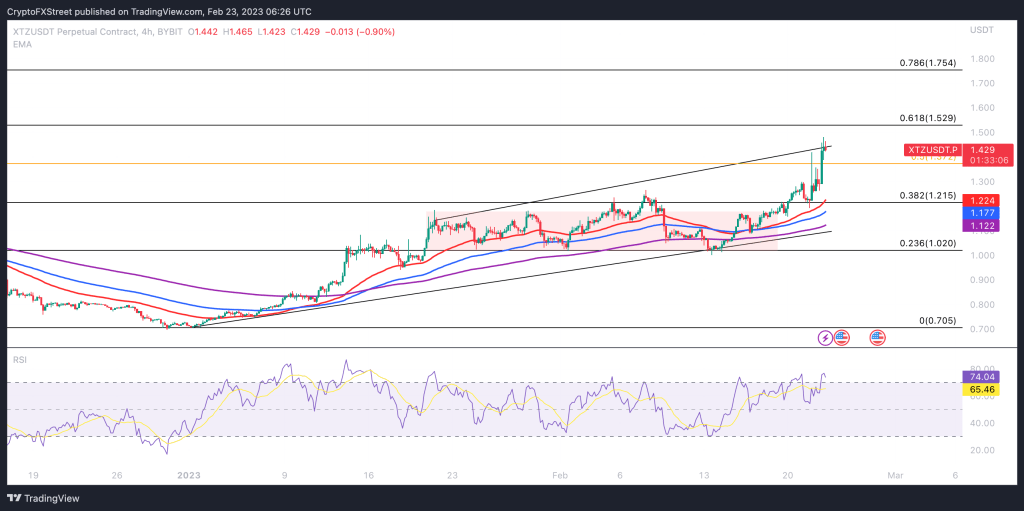
There is a key support zone between $1,017 and $1,177, where XTZ spent about 30 days from mid-January to February. Since the announcement of Google Cloud’s partnership, XTZ has continued its short-term uptrend, climbing higher, approaching the 61.8% Fibonacci Retracement at $1,529.
If the bulls push XTZ towards the 61.8% Fib tracking target, a further increase from the $1,754 low to 78.6% high is likely. As XTZ price is forming higher highs, the bearish divergence in the RSI signals a lack of underlying strength in the current uptrend. If XTZ price breaks below the 50% Fibonacci Retracement at $1,372, it could drop into the $1,017 and $1,117 support zone, where it remains for about 30 days. If XTZ fails to stay above the $1,300 level, it will invalidate the bullish argument for the Tezos protocol native token.
Dogecoin price shows potential
DOGE prices implicitly show strong kinetic potential. The fixed volume profile indicator (FVPR) is a technical analysis tool that shows the volume traded at each price level and can help traders identify key support and resistance levels. Dogecoin’s FVPR surrounding the last two trading quarters of 2022 is consolidating precisely at DOGE’s main average price. This is indicated by DOGE’s position adjacent to the strong red line in techniques called Volume Weighted Average Price (VWAP).
FPVR’s VWAP suggests that Dogecoin’s current price is at a fair market value and that the 25% bullish action witnessed this winter is only the beginning stages of a true crypto season-style rally. Dogecoin price is currently trading at $0.084. The Relative Strength Index on the weekly timeframe confirms this bias as it spikes into the major resistance zone near $0.14 in November 2022.
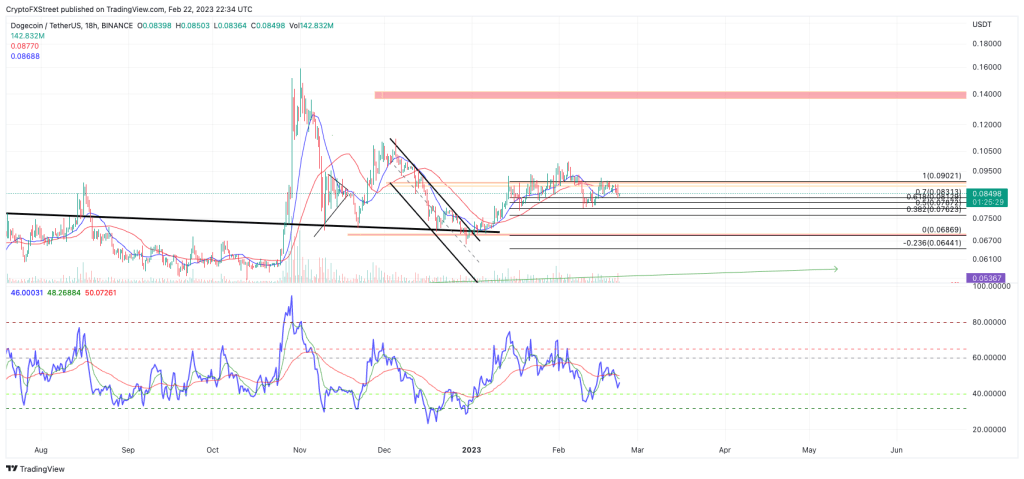
The RSI has been bouncing back and forth since its first northward move and most recently climbed above the 50-level midline during its 25% move in winter. This thesis proposes that the market is in an upward consolidation phase. DOGE’s market structure confuses the idea of building momentum, as bullish support is common around rising support levels in the $0.07 low.
Traders should consider what the final structure will look like for a price bottoming out in this volatile market environment. Also, be on the lookout for any wedge-like patterns to end the three-way retraction structure. VWAP and market structure suggest that a drop towards $0.071 would be seen as a discount. Ultimately, the bulls could once again challenge trading liquidity above the $0.14 zone in the future. The bull scenario creates the potential for a 60% increase from the current market cap of Dogecoin.
Shiba Inu price close to support
Shiba Inu price sees opportunistic traders exit and cash out after another strong rally since early February. A big line in the sand for the rally since January comes from the orange ascending trendline, which is of great importance in this rally. SHIB fell further before breaking higher from this trendline.
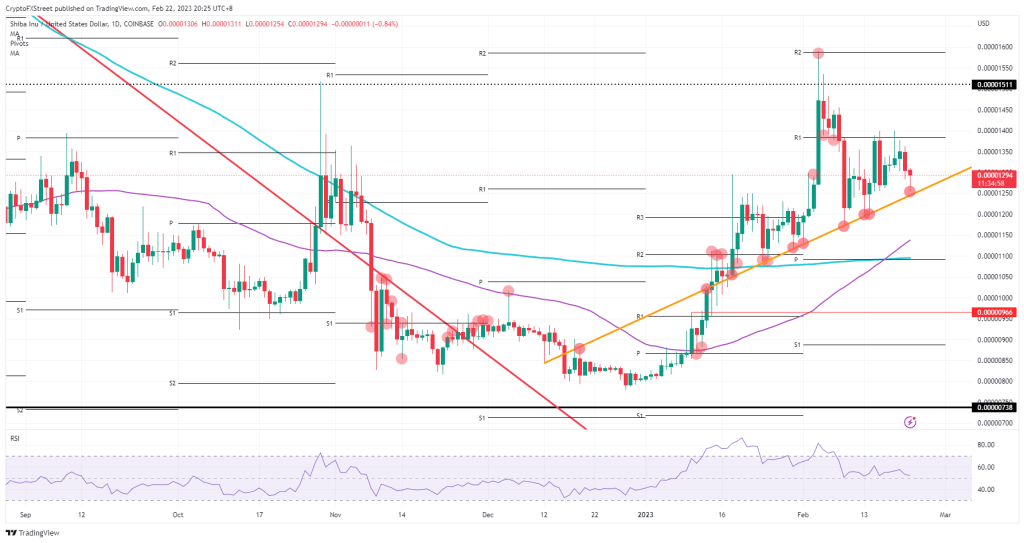
SHIB traders will see the smarter coin enter the orange ascending trendline with a longer-term projection of when it will emerge. This makes every bounce in SHIB more successful and could result in a massive upside boom in the near future. When the bounce exceeds $0.00001400, a 25% gain opens the way for $0.00001600.
A definitive break of the orange ascending trendline signals a clear and present danger that the entire rally could be dissolved. Any catalyst such as geopolitics, data, or central banks can work. Luckily, the 200-day Simple Moving Average is near $0.00001100, aligning with the monthly pivot to keep losses at around 13%.
Increased interest in Binance altcoin
After a sharp downside correction, LINK price found support in the $7.30 region against the US Dollar. A bottom was formed near $7.31 and the price started a fresh increase similar to bitcoin and ethereum.
There was a clear move above the $7.50 resistance zone. The price even broke the 50% Fib retracement level of the recent decline from the $8.37 high to $7.31 low. Chainlink is now trading above the $7.80 level and the 100 simple moving average (4-hours). There is also a key bullish trend line forming with support near $7.65 on the 4-hours chart of the LINK/USD pair. On the upside, the price is facing resistance near the $8.00 zone.
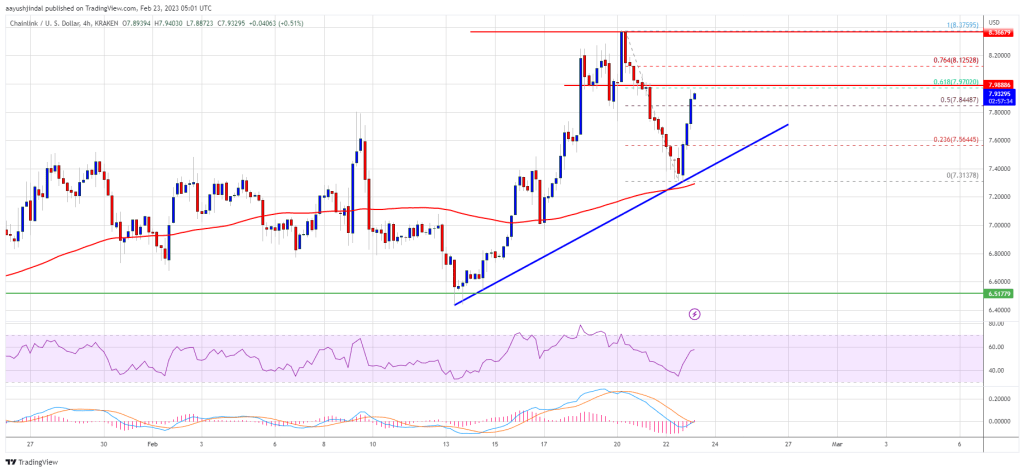
The 61.8% Fib retracement level of the latest drop from the $8.37 high to $7.31 low is also near the $8.00 resistance area. A clear break above $8.00 is likely to start a fresh rise towards the $8.50 and $8.80 levels. The next major resistance is near the $9.50 level, above which the price might revisit $10 or even $10.20.


