Gold prices started the week with a bullish note. It subsequently broke above $1,800 for the first time since mid-July. Despite soft inflation data, the dollar remained surprisingly resilient against its rivals. That also came under modest bearish pressure in the second half of the week. The Federal Reserve will release the minutes of its July policy meeting next week. Market participants will look for new clues as to the extent of the Fed’s next rate hike.
US CPI data triggers gold prices rally
Friday’s impressive jobs report fueled the dollar rally. In addition, investors reserved their profits ahead of the highly anticipated US inflation data. Due to these developments, the dollar lost its strength at the beginning of the week. Gold, on the other hand, gained about 1% on Monday. It closed the day near $1,790. Fed Chair Michelle Bowman said she strongly supports super-high rate hikes to fight inflation. However, he noted that market participants refrained from placing any further bets on a 75 basis point hike in September.
The trading activity on Tuesday remained stagnant. In this environment, gold continued to rise towards $1,800 as US Treasury bond yields retreated. Data from the US revealed that Unit Labor Costs increased by 10.8% in the second quarter. The data came in above the market expectation of 9.5%.

The U.S. Bureau of Labor Statistics reported Wednesday that the U.S. CPI fell to 8.5% year-on-year in July from 9.1% in June. Additionally, Core CPI, which excludes volatile food and energy prices, remained unchanged at 5.9%. This data also fell short of analysts’ estimate of 6.1%. With the initial market reaction to the data, the dollar came under heavy selling pressure. Gold hit a one-month high above $1,800. According to the CME Group FedWatch Tool, the probability of a 75 basis point Fed rate hike in September dropped from 70% to 30% before the CPI data were released. By contrast, the benchmark 10-year US Treasury bond yield fell as low as 4%, fueling gold’s rally.
The Fed has not backed out from its hawkish stance
However, FOMC policymakers reminded the markets that they would not overreact to a single inflation data. Minneapolis Fed President Neel Kashkari and San Francisco Fed President Mary Daly noted that they are still far from declaring victory over inflation. In a hawkish note, Chicago Fed President Charles Evans said the Fed was not done with rate hikes. He also added that he expects the federal funds rate to exceed 4%. Following these comments, the prospect of a 50 basis point September rate hike dropped below 60% on Thursday, causing gold to retreat from monthly highs to $1,790.
cryptocoin.com As you follow, in an interview with Bloomberg late Thursday, Daly admitted he was open-minded about a 75 basis point hike in September. The dollar rebounded on Friday, forcing gold to lag behind. Finally, the University of Michigan’s Consumer Sentiment Survey for August revealed that the long-term inflation outlook improved from 2.9% to 3%. These data have helped the dollar continue to outpace its rivals. It limited the upward movement of gold ahead of the weekend.
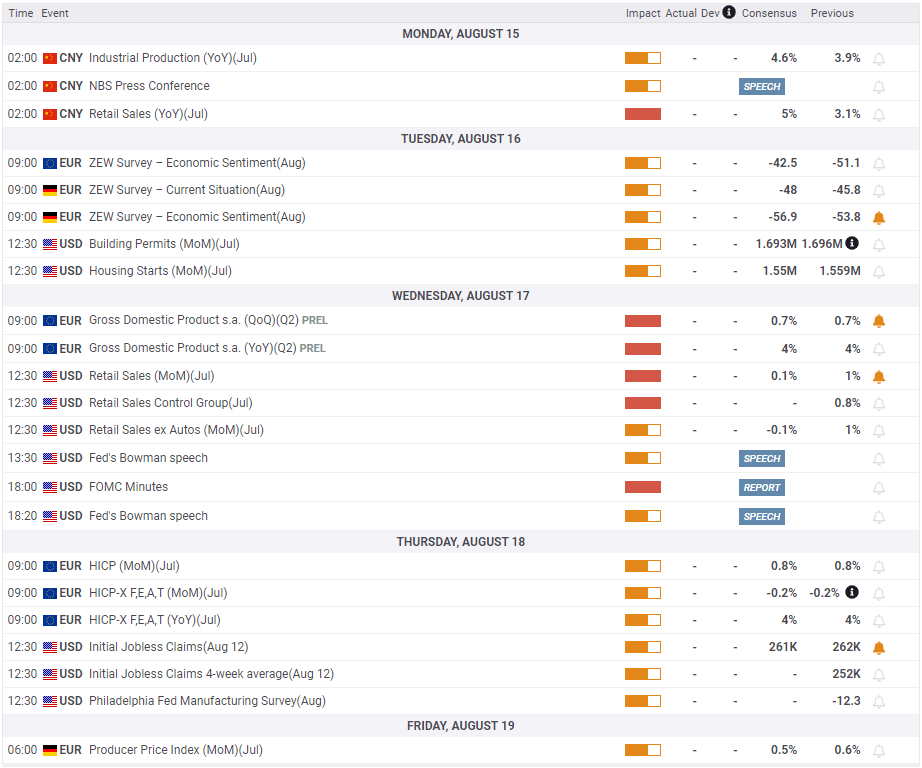
“A sharp drop in Housing Starts could trigger a flight to gold”
Markets will be looking at Retail Sales data from China at the start of the week for fresh momentum. Investors expect sales to increase by 5% year-on-year in July, following a 3.1% increase in June. Market analyst Eren Sengezer makes the following assessment:
The impact of this data on gold’s valuation is likely to be short-lived. However, weaker-than-expected data is likely to suppress risk sensitivity. It can also push gold down by providing support to the dollar and vice versa.
On Tuesday, Building Permits and Housing Starts data for July will appear in the US economic dossier. The real estate market is under pressure due to rising mortgage rates. Investors are increasingly worried about a possible housing crisis. Therefore, a sharp drop in Housing Starts is likely to trigger a flight to safety, according to the analyst. It is also likely to help strengthen the dollar.
“Gold is likely to move inversely with US bond yields”
On Wednesday, the U.S. Census Bureau will release data on Retail Sales for July. Additionally, the FOMC will release the minutes of its July policy meeting. The publication appears to confirm that policymakers will continue to monitor the data before committing to a specific rate hike in September. The analyst interprets the impact of the minutes as follows:
If the minutes show that the Fed sees an increased risk of recession, the dollar is likely to lose altitude. This too is likely to open the door for a higher leg for gold prices. On the other hand, investors may be convinced that the Fed will remain on an aggressive tightening path until they see consecutive declines in inflation figures. In this case, they may reevaluate the Fed’s interest rate outlook. In short, gold is likely to move inversely with US bond yields in the middle of the week.
Thursday’s weekly Initial Jobless Claims and Philadelphia Federal Reserve Bank Manufacturing Survey will be the final data for the week. The market is not expected to react significantly to these data. The analyst summarizes the current situation as follows:
Market pricing of the Fed’s rate outlook will continue to drive the valuation of the dollar and the movement of gold in the short term.
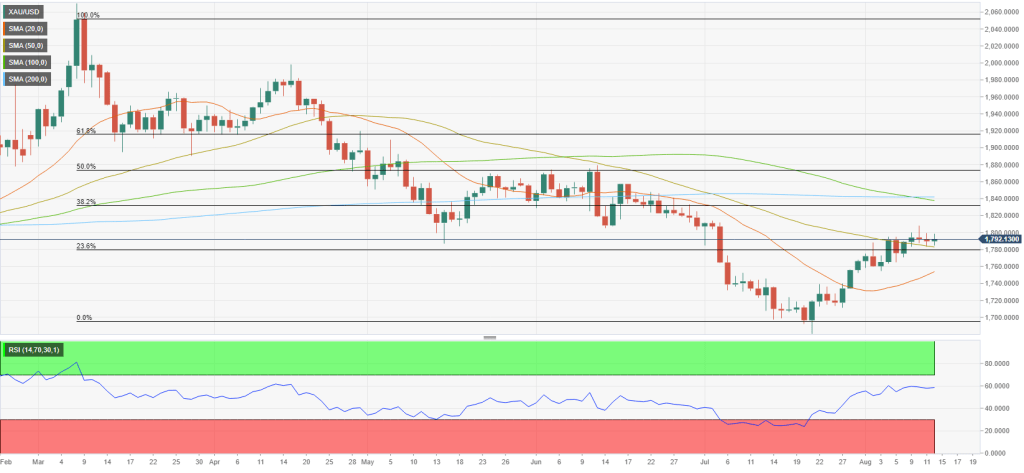
Gold prices technical view
Market analyst Eren Sengezer analyzes the technical outlook of gold as follows. The technical bullish trend of gold remains intact in the short term. The Relative Strength Index (RSI) indicator on the daily chart remains stable around 60. Gold prices managed to close above the 50-day SMA in the last four days.
However, it limited this week’s advance to $1,800. It looks like buyers will refrain from betting on more gold strength unless this resistance fails. Above this level, $1,830 (38.2% Fibonacci retracement of the latest uptrend) stands as the next bullish target ahead of $1,840, where the 100-day and 200-day SMAs are located. On the downside, key support seems to be formed at $1,780 (50-day SMA, Fibonacci 23.6% retracement) before $1,750 (20-day SMA).