Yellow metal started the week under selling pressure. Thus, gold prices fell to $ 1,620 on Monday. However, it rebounded and closed four days in positive territory. Gold ended its two-week streak ahead of next week’s ISM PMI surveys and September jobs report.
Gold prices hit the bottom of the last two years with the UK chaos
The turmoil created by the bond sales in the UK at the beginning of the week in the global bond markets put pressure on low-yield gold. Gold turned south as the 10-year US Treasury yield rose to 4% on Monday. Accordingly, it recorded the lowest daily close since March 2020 at $1,622.
The yellow metal beat bearish pressure on Tuesday and closed the day modestly higher. Monthly data released by the Conference Board showed that the Consumer Confidence Index in the US rose from 103.6 in August to 108.00 in September. The dollar gained some strength with the initial reaction. However, the underlying details of the publication revealed that 1-year Consumer Inflation Rate Expectations fell from 7% to 6.8%, limiting the USD’s upward movement.
Gold prices rose as BoE intervened in the bond market
cryptocoin.com On Wednesday, the Bank of England (BoE) bond market intervened. This triggered a sharp decline in global bond yields. BoE announced that it will make temporary purchases of long-term government bonds to restore the functioning of the market. Led by a 10% drop in the 10-year UK bond yield, the 10-year US T-bond yield lost more than 5%. This allowed the inversely proportional gold to gain bullish momentum. Thus, gold prices rose by about 2%. This marked the biggest one-day gain since the end of March.
This move of the BoE diverted the attention of the markets from the dollar. It also paved the way for a belated correction in the US Dollar Index (DXY). DXY is down more than 2% in the second half of the week as the dollar faces strong bearish pressure. Data from China during Asian trading hours on Friday showed that NBS Manufacturing PMI rose from 49.4 in August to over 50 expansion territory in September. Following that, gold rallied to a one-week high above $1,670 on Friday.

Gold fails to maintain bullish momentum as core PCE rises
Meanwhile, the US Bureau of Economic Analysis (BEA) reported on Thursday that real Gross Domestic Product (GDP) contracted 0.6% year-on-year in the second quarter. This data matched the previous forecast and market expectation. Hence, it did not create a noticeable market reaction. The BEA announced Friday that its Personal Consumption Spending Price Index dropped to 6.2% year-on-year in August from 6.4% in July. However, core PCE inflation rose to 4.9% over the same period. This made it difficult for gold to maintain its bullish momentum.
It is also worth noting that the People’s Bank of China (PBoC) has taken measures this week to limit the depreciation of the CNY. The PBoC increased the required ratio from 0% to 20%, reinstating the reserve requirement rule for banks’ CNY forward sales. China’s gold demand recovery is possible if this action has the intended impact on the CNY exchange rate. Therefore, it is likely to be supportive for gold prices.

Investors will closely monitor global bond markets
Market participants will follow the global bond markets closely next week. The UK bond market appears to have stabilized after the BoE’s intervention. But investors are likely to quickly lose confidence if the UK government doesn’t address concerns about pushing the economy down a path of unsustainable debt, according to market analyst Eren Şengezer. The analyst makes the following assessment:
Another push in the global bond sale is likely to weigh on the precious metal. On the other hand, another drop in bond yields is likely to help gold rise if the UK realigns its fiscal policy and provides more relief to bond markets.

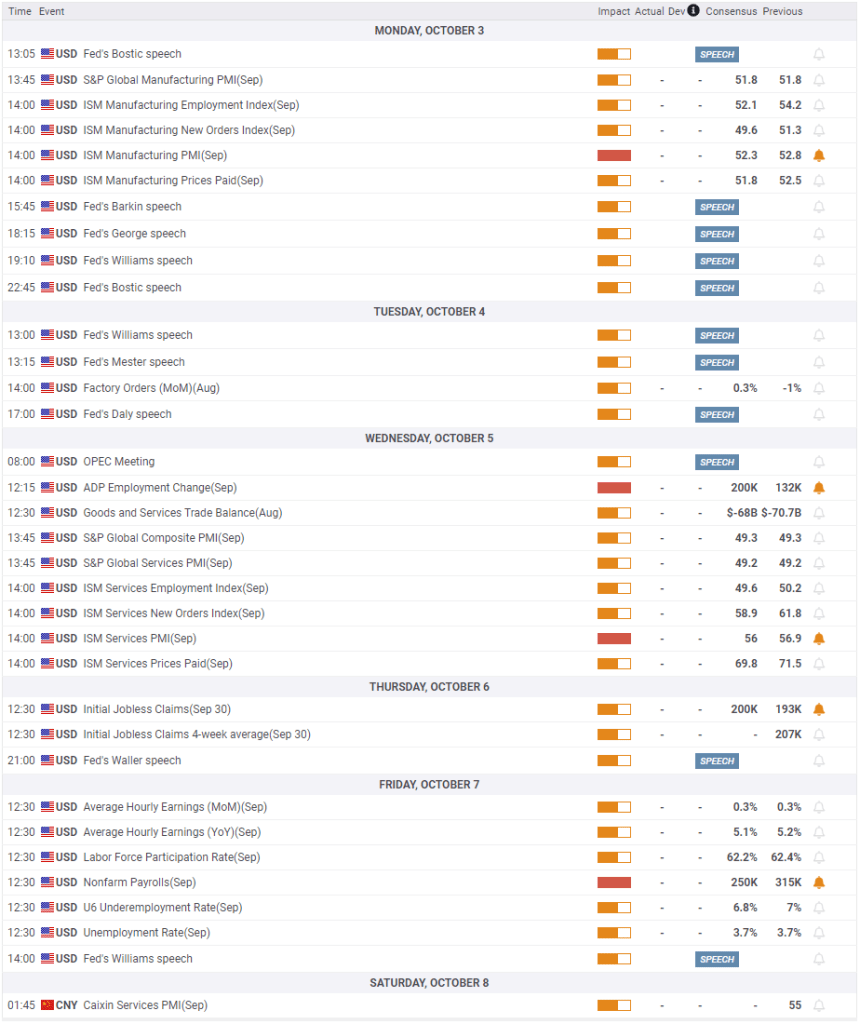
ISM Manufacturing PMI data will arrive on Monday
The US economic report will include September ISM Manufacturing PMI data on Monday. The data is expected to remain unchanged at 52.8. The inflation component of the survey, the Price Paid Index, fell to 52.5 in August. According to the analyst, data below 50 in September will indicate falling input prices for the manufacturing sector and will boost gold.
On Wednesday, ISM Services will release its PMI report. Price pressures in the services sector were relatively strong in August. Also, the Price Paid Index reached 71.5. The analyst notes that a significant slowdown in services sector inflation is likely to hurt the dollar. It reminds me that the reverse is also true.
Data for the week will be Friday’s US jobs report
On Friday, the U.S. Bureau of Economic Analysis will release its September employment report. Markets expect Non-Farm Employment to increase by 250,000 after 315,000 in August. Weekly Initial Unemployment Claims have been falling steadily since mid-summer. However, the employment components of the August PMI surveys showed a significant slowdown in private sector employment growth.

According to the latest Forecast Summary (SEP), Fed officials are projecting an Unemployment Rate of 3.8% by the end of the year and 4.4% by the end of 2023. Policy makers stated that they would prioritize the fight against inflation. Accordingly, they have openly stated that they will continue to increase interest rates until they reach the target. There are signs that unemployment is rising steadily. On the other hand, the labor market figures for September are unlikely to significantly affect the Fed’s policy outlook. The analyst interprets the impact of the data as follows:
However, investors may see weaker-than-anticipated NFP growth as an excuse to sell the dollar ahead of the weekend and open the door for bullish action below. On the flip side, it’s possible that market participants will try to add to their dollar longs if NFP rises at a stronger pace than predicted.
Gold prices technical outlook and gold sentiment survey
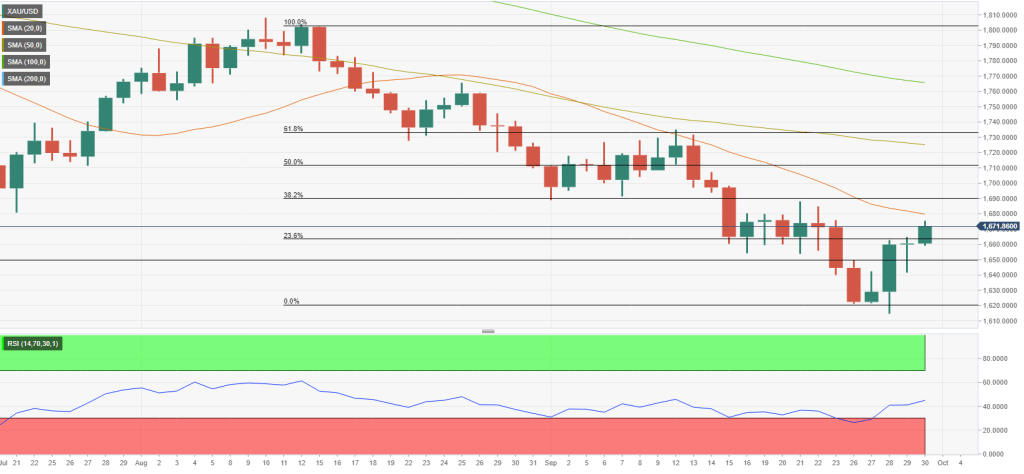
Eren Şengezer analyzes the technical outlook of gold as follows. Gold is facing immediate resistance at $1,680, where the 20-day SMA is located. If the yellow metal breaks above this level and starts using it as support, it is possible to target $1,690 and $1,700. Ideally, the Relative Strength Index (RSI) indicator on the daily chart stays above 50 in this scenario. This confirms the bullish change in the technical outlook.
On the downside, $1,665 stands as initial support before $1,650 (static level). A daily close below the second level can be seen as an important bearish development. This, in turn, is likely to lead gold to drop to $1,620 towards the end of the downtrend.
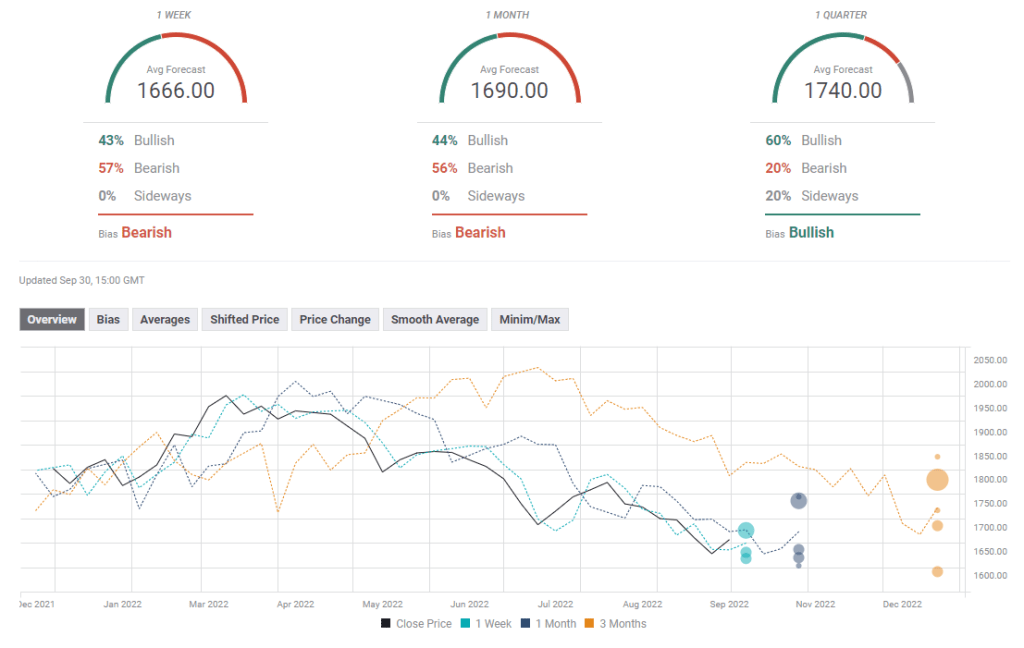
The FXStreet forecast survey paints a mixed picture for gold in weekly and monthly views. Average targets for these periods are $1,666 and $1,690, respectively.