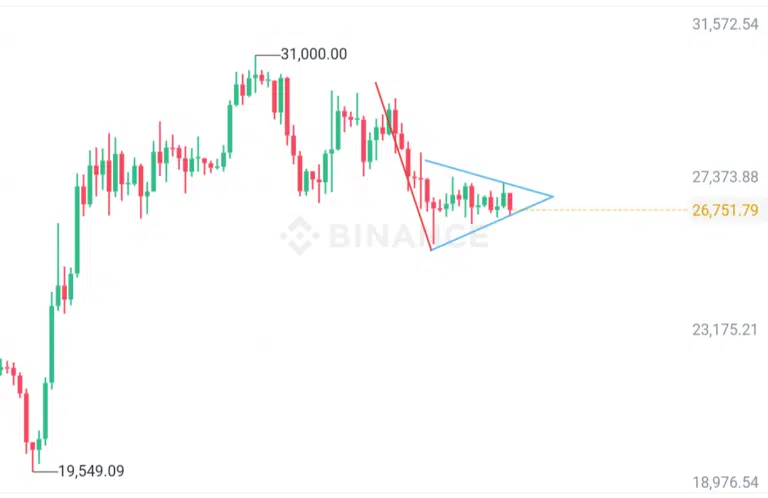
Legendary analyst Peter Brandt draws attention to an important formation on the Bitcoin (BTC) chart. Citing data from the daily Bitcoin chart, Brandt recommends caution when identifying a bearish pennant formation created by the asset.
Peter Brandt sets ‘bear pennant’ on Bitcoin chart!
After a brief recovery period, Bitcoin (BTC) succumbed to bearish pressure. Thus, BTC fell below the $27,000 threshold. While market participants are hopeful of a rebound, veteran analyst Peter Brandt says the asset is likely to drop further from its current position. In a recent tweet, Brandt spotted a ‘bear pennant pattern’ forming on BTC’s daily chart.
This is known as a pennant or flag and has short term bearish implications unless negated by close above mid point highs. $BTC pic.twitter.com/kLz6aTHMrz
— Peter Brandt (@PeterLBrandt) May 24, 2023
According to the successful analyst, the pennant signals a short-term bearish price action for Bitcoin unless the asset closes above the midpoint highs. In case of closing above the midpoint, the pennant formation will be invalid. The midpoint shows the average between the high and low prices in the consolidation range.
A pennant or flag is a common chart pattern that indicates a temporary consolidation before the resumption of the previous trend. It is considered a continuation pattern as it indicates that the price will continue to move in the same direction as before the formation of the pattern. It is possible for the pennants to be bullish or bearish depending on the previous trend. The latest pennant identified by Brandt indicates that the current bearish trend will continue. Therefore, it is in a bear trend. This is likely to lead to a further decline in Bitcoin’s value.
Analysts are also confirming Brandt’s chart patterns. Bitcoin, in particular, formed the flagpole of the pennant after falling from $29,820, on May 6. The asset posted consistent losses at $29,820, posting 8 consecutive daily losing sessions from May 6 to May 13. BTC’s reversal resulted in a consolidation, setting the flag.
 Bitcoin BTC Bear Pennant
When the flag occurs, it indicates that market participants took a short break, causing the price to consolidate in a smaller range. This consolidation typically occurs due to indecision or declining market activity. While the pennant shows that the downtrend will continue, if BTC closes above the midpoint value of Brandt, it is possible to completely eliminate the pattern.
Can Bitcoin recover?
With this, cryptocoin.com It should be noted that Brandt revealed in an analysis two days ago that BTC will likely experience “one more jolt” before jumping to higher values. However, the analyst emphasizes that this prediction is only a “guess”. The asset was trading around $26,800 at the time and was stuck in continued consolidation.
Market participants continue to question whether the phrase “one more jolt” relates to the expected continuation of the recent downtrend, as the analyst has not made any further comments.

BTC, approaching historic oversold levels
After the crypto market-wide decline, Bitcoin slumped below the $27,000 mark as traders in the equity markets reacted to weak UK inflation data. The core Consumer Price Index (CPI) rate for the UK was warmer than expected. The CPI stood at 6.8%, the highest level since 1992, compared to the expected 6.2%.
At press time, Bitcoin is down 3.55% in the last 24 hours to $26,246. According to a recent Glassnode analysis, Bitcoin has historically been approaching oversold levels. This analysis shows that aMVRV is currently recording 1.09 and only 9% of unrealized profit is still available in the market. “This coincides with historically oversold levels at both the 2018, 2019 and March 2020 cycle lows,” Glassnode explained. The Adjusted MVRV Ratio rose to 1.21 after the recent Bitcoin rally above $30,000. This represents a rather modest level of unrealized profit of 21%.


