Bitcoin price bounces back after the 200-week SMA was rejected at $22,486. Dogecoin, on the other hand, is waiting for the moves of the bulls in the range of $ 0.049-0.078. FXStreet analyst Akash Girimath evaluated the levels that will be critical for Bitcoin and Dogecoin this week. Let’s take a look at the analyst’s expectations, keeping in mind that the estimates are not certain.
Dogecoin price and potential
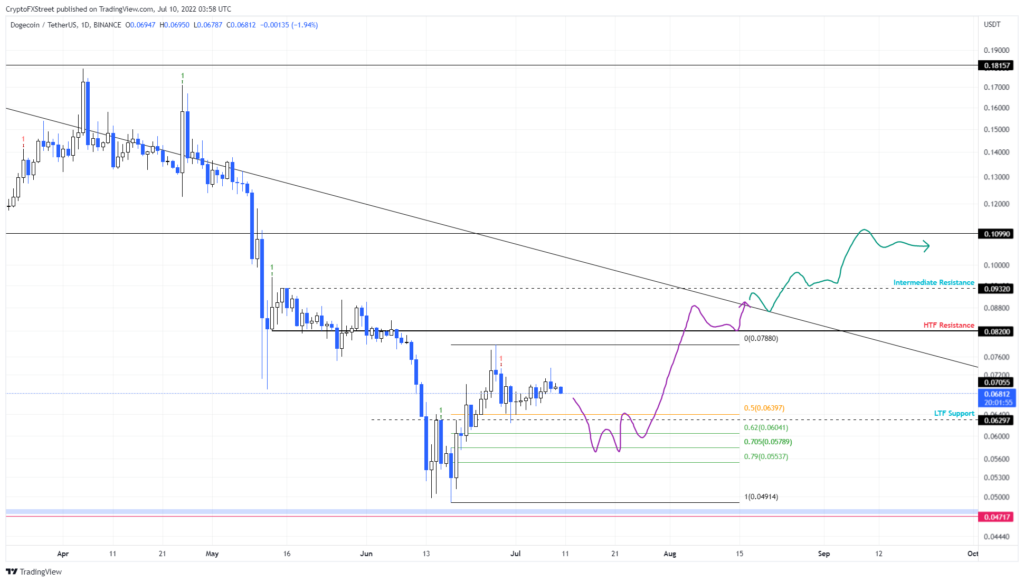
The Dogecoin price gained around 60% between June 18 and June 26. Meanwhile, it traded in a range stretching from $0.049 to $0.078. DOGE pulls back 20% as its bullish momentum wears off. It then bounced off the midpoint at $0.063.
While the leap makes sense, the improvement in Bitcoin price is pushing DOGE to other significant levels. The deep discount mode from $ 0.055 to $ 0.060 allowed swing traders to take positions. A bounce from the $0.057 level is targeting $0.082, up 41%. This level coincides with the descending weekly trend line. Hence, this is where Dogecoin price can limit its rise.
However, if the bullish momentum is strong, Dogecoin price will overcome the descending trendline that has been keeping DOGE under pressure for more than a year. In such a case, the analyst expects DOGE price to rise to $0.093 and then $0.109. This move will constitute a roughly 90% rise overall.

On the other hand, Dogecoin price continues to rise slightly overall. Traders should not ignore the possibility of the daily candlestick falling below the $0.049 low. Such a development would invalidate the bullish thesis for the leading meme coin. This scenario of the analyst means a 5% drop in Dogecoin price and a revisit of $0.047.
Bitcoin price pushes the impossible
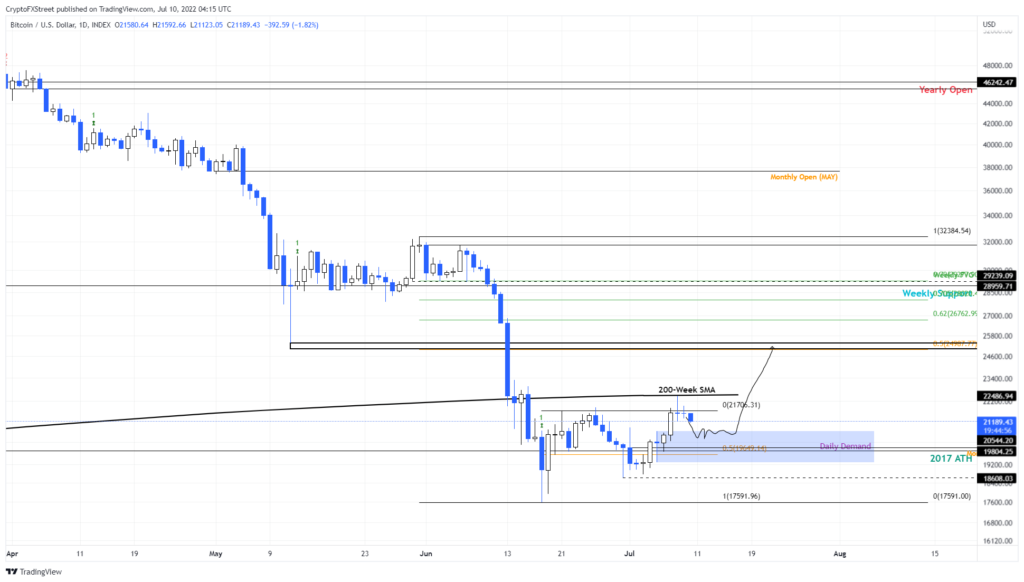
Bitcoin price tested the 200-week SMA line on July 08. He made this attempt for the first time since his first fall on June 16. The rejection singles out the leading crypto, pulling it into the $20,726 to $19,284 daily demand zone. This area was key to pushing Bitcoin price above the $21,706 high range. Therefore, a retest of this demand zone will trigger another uptrend. This time, however, it may break the 200-week SMA line to the downside.
Assuming BTC bulls overcome this hurdle, it is likely to continue higher towards the $24,987 resistance. This level is the midpoint of the range. It is also where the downside move from $32,384 to $17,591 is capped. Altogether, this move will constitute a 20% rise for Bitcoin price from its current position at $20,726.

While the move to $25,000 makes technical sense, investors should keep in mind the demand zone between $20,726 and $19,284. Also, BTC needs to surpass $22,486 permanently. Rejecting any of these levels, which drove bitcoin price lower to produce a daily candlestick near $18,608, would create a lower bottom and invalidate the bullish thesis. BTC could even take this one step further. If it produces a weekly candlestick below $17,591, we could likely see Bitcoin price at $15,000.


