
Bitcoin wind blew in the cryptocurrency market. The leading crypto witnessed a rally that extended to over $31,000 with the effect of positive news. Leading altcoin Ethereum has made more modest gains. The Rainbow chart for Bitcoin and Ethereum sets prices up to the beginning of 2024.
Bitcoin Rainbow chart determines BTC price for January 1, 2024
cryptocoin.com As you follow, Bitcoin was met with strong optimism after prominent institutional investors applied to launch a spot Bitcoin (BTC) exchange-traded fund (ETF) earlier this week. Thus, BTC price broke above the $30,000 milestone for the second time in 2023.
Investors and analysts, who are curious about its future trajectory, are eagerly awaiting the extent to which Bitcoin’s current rally will expand. To learn more, analysts look at the rainbow price chart from BlockchainCenter, a tool that shows BTC’s historical movements relative to different moving averages (MA). According to the chart, BTC has just entered the ‘Save Up’ phase, currently standing in the price area between $29,895 and $39,198.
 Price prediction of Bitcoin rainbow chart / Source: BlockchainCenter
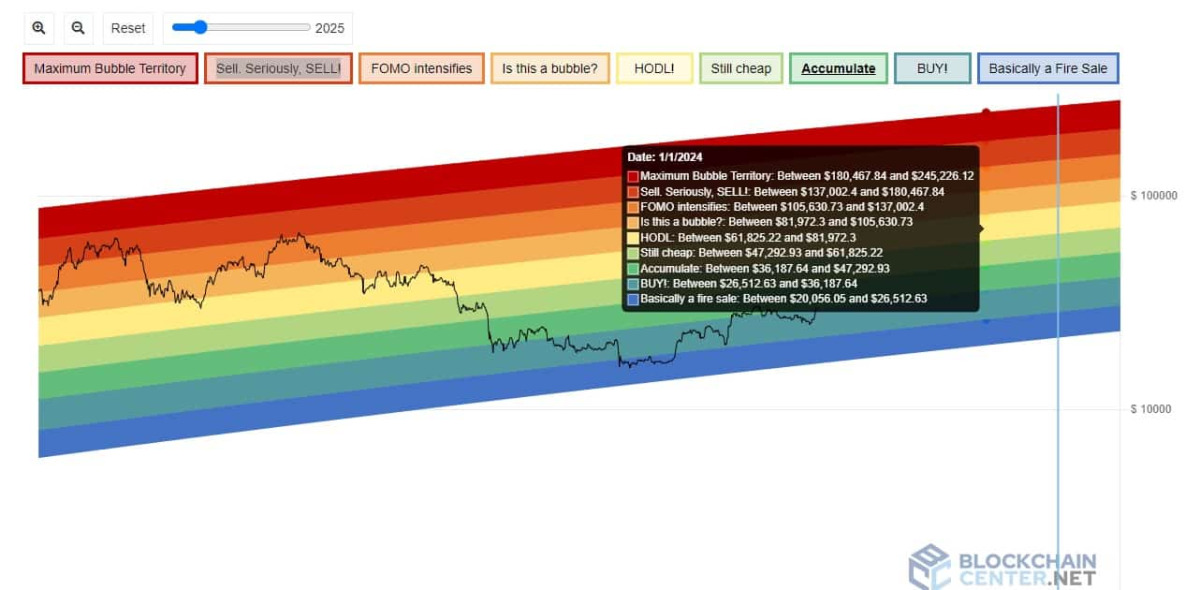
The Bitcoin rainbow chart uses a logarithmic growth curve to predict the potential future direction of BTC. To do this, the tool places rainbow color bands on the curve to highlight market sentiment in each rainbow phase the price reaches, thereby drawing attention to different bullish or bearish scenarios.
bitcoin price projection
According to the initial forecast for the end of 2024, the best possible scenario for Bitcoin is called the “Maximum Bubble Zone”. This region, highlighted in dark red, identifies a price area of $180,467 to $245,226 compared to the most bearish scenario (dark blue) of $20,056 to $26,152 on January 1, 2024. However, if Bitcoin’s price is to repeat its earlier patterns, it means that BTC will indeed be near its top bullish zone by 2024. The same scenario happened in 2017, when BTC skyrocketed from the ‘Accumulate’ phase in May to the ‘Max Bubble Zone’ in December and then slightly dropped into the ‘Sat’ zone. ‘Really SELL!’ region (red) at the beginning of 2018.
Ethereum Rainbow chart determines ETH price for January 1, 2024
Ethereum has failed to regain the psychological threshold of $2,000 despite the recent positive momentum in the broader crypto market. However, BlockchainCenter’s rainbow price chart for Ethereum, the Ethereum outlook may not be bearish for the beginning of the year 2024. According to analysts, this chart shows that Ethereum is currently still in the ‘Fire Sell’ phase, highlighted in purple, and ranges between $0 and $2,593 below the ‘Value’ blue zone between $2,593 and $3,668.
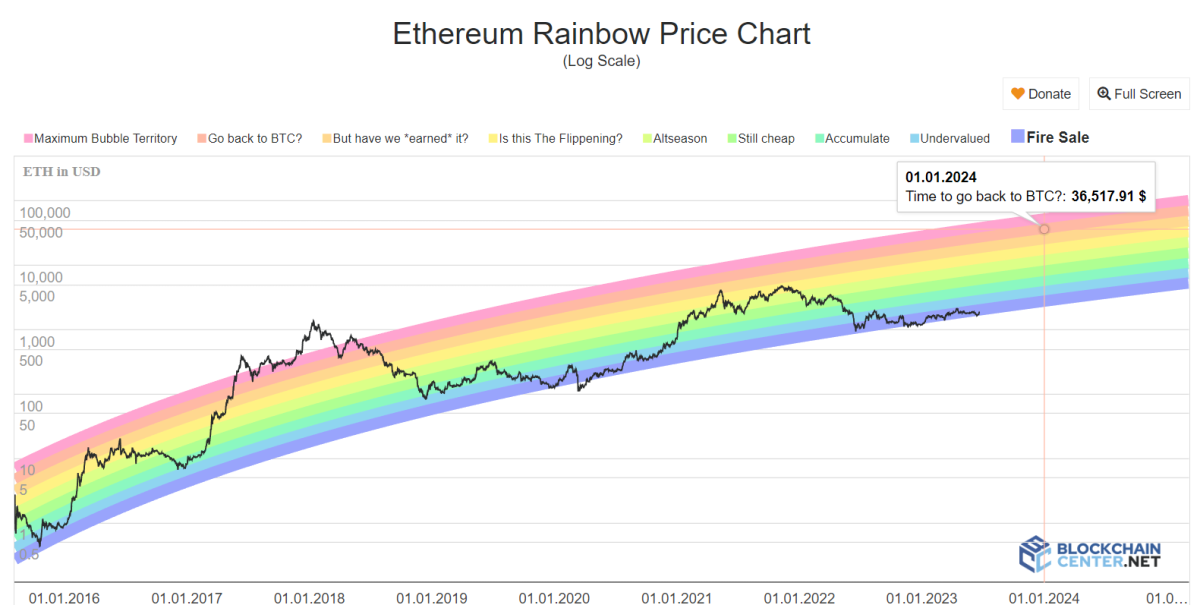 Ethereum rainbow price chart / Source: BlockchainCenter
Ethereum price projection
In particular, Ethereum has been stuck in the ‘Fire Sale’ zone since the beginning of October 2022. Also, based on its previous behavior, it is possible for it to exit this area within a few weeks. Meanwhile, ETH moved into the ‘Undervalued’ region in July 20202, after an eight-month period in the ‘Fire Sale’. When we examine the numbers further, we see interesting things. Because Ethereum, at $ 4,336 “But did we deserve it?” It took 10 months to reach level. If the same trend happens this time, it means that ETH will end in the same region (currently between $16,353 – $23,742) by April 2024.
In other words, seven months from now, around January 1, 2024, Ethereum could be changing hands in the ‘Still cheap’ price area on the rainbow chart. Based on the same model, this price range is currently between $5,290 and $7,705. Prior to this move, Ethereum was only in the ‘Fire Sale’ zone once – in October 2015. ‘Back to BTC after four months?’ rose to the price level. It then fell into the ‘Undervalued’ region in January 2017. Here he remained for a very short time, until he rose again and went beyond the ‘Maximum Bubble Territory’.
Should this pattern repeat, Ethereum will be asking “Back to BTC?” at a price between $23,742 and $34,283 in October 2023. It would mean that it could skyrocket to the “Value” zone between $2,593 and $3,668 once again in January 2024. Alternatively, another Ethereum Rainbow Chart tool from CoinCodex suggests that for the same scenario, if ETH price stays in the ‘Value’ (or ‘BUY!’) zone in January 2024, the asset price will hover around $778 per coin.
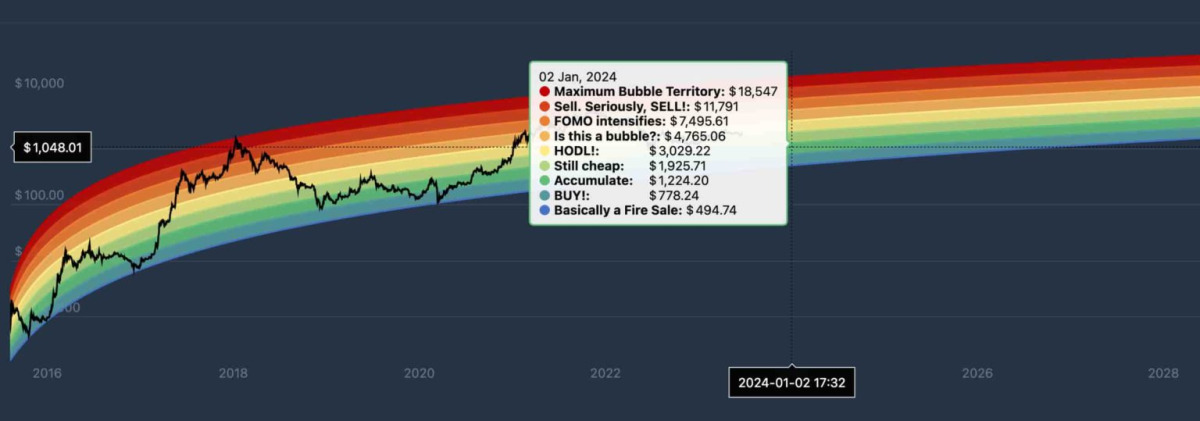 Ethereum rainbow price chart / Source CoinCodex.com


