Bitcoin price has entered a spiral where it has rebounded its losses following the week’s SEC lawsuits. In general, rising prices despite negative news indicate the bottom of current levels. Technically speaking, the Bollinger Bands are also currently giving green signals.
Bollinger Bands herald high volatility in Bitcoin
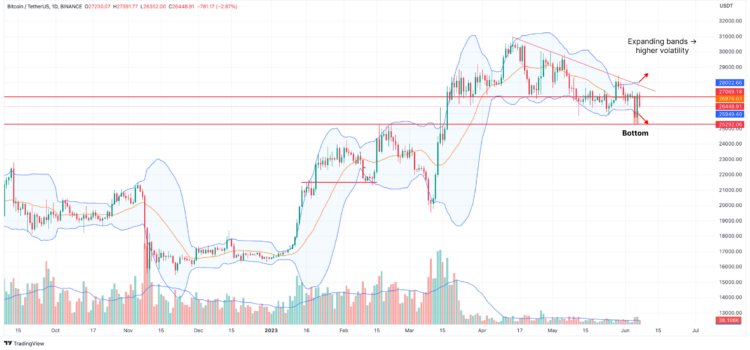
As Glassnode co-founders Jan Happel and Yann Allemann wrote in their recent analysis, Bitcoin’s Bollinger bands largely reflect the current situation. On the daily chart, BTC price remains in the accumulation zone between the lower band and the 20-day moving average.
“These signals suggest current levels are still a good entry point,” analysts say. At the same time, citing the chart below, they warn that traders should be aware of broadening bands, which could herald higher volatility that could lead to spikes.
Looking at Bitcoin’s open interest, Allemann and Happel note that despite the strong reaction to the bad news, there is no clear direction for now:
We believe the price will continue to consolidate with open interest until we approach the FOMC and the market begins to position for expected output.
Pay attention to these dates
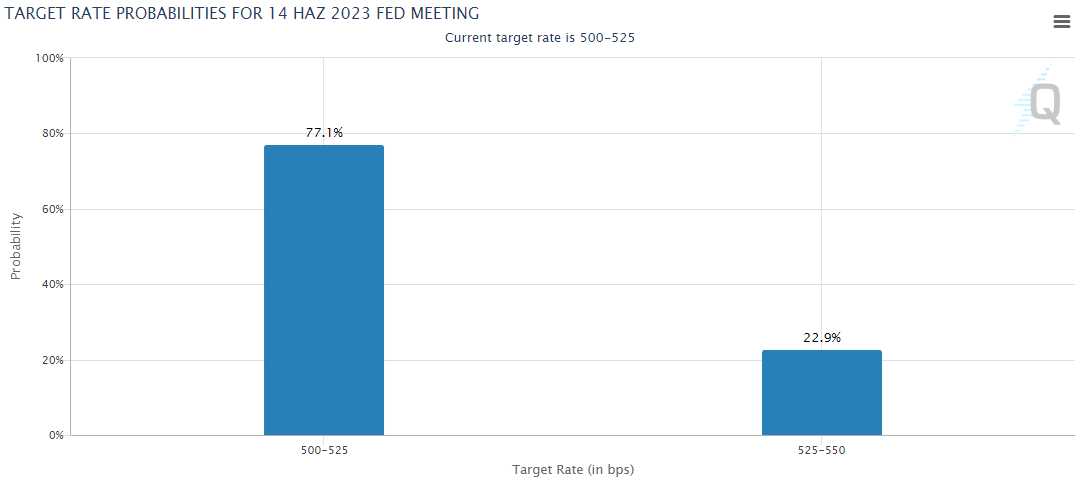
The Fed meeting, which will be held on June 13-14 next week, will be critical on the cryptocurrency market. Ever since the Fed started raising interest rates, there has been a clear consensus at every meeting. The decision may differ this time.
Futures, according to the CME FedWatch tool, show that there is a 30% probability that rates will be raised and a 70% probability that they will not. The lack of clarity is likely to lead to more volatility in BTC price before the interest rate decision.
Meanwhile, June 13 will also witness the SEC’s critical Binance and Ripple lawsuits. cryptocoin.com As you follow, Binance is required to respond to the subpoena on this date. On the other hand, Ripple investors are waiting for the Hinmann documents to be made public.
What levels does technical analysis point to for Bitcoin?
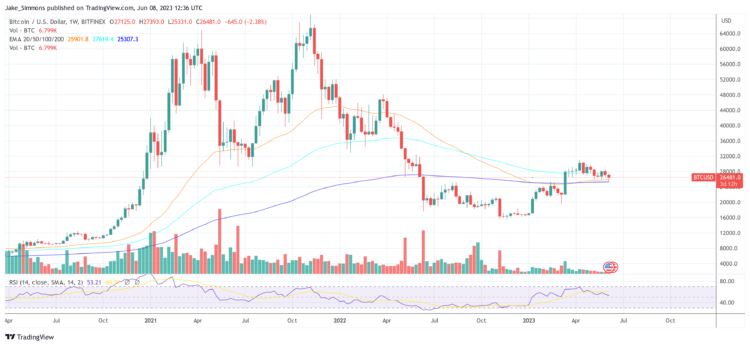
Technically speaking, Bitcoin recently retested the 200-week MA at $25.306. However, the supply liquidity was somewhat weak here. Additionally, if the price drops again, a retest of the 50-month MA at $25,898 will be very interesting, with liquidity and sentiment appearing stronger.
It is worth noting that BTC has already formed a double bottom at the 50-month MA. Now there will be a triple bottom rise. On the other hand, a loss of the 200-month MA suggests further declines.
In summary, Bitcoin bulls are waiting for a very important few days in the coming weeks. It is extremely important to defend the above-mentioned price levels. If defended, the bulls will engage again for higher highs. However, the bulls need to reverse the situation on the lower timeframes.