Having been commuting in the same price zone for almost a month BTCBy testing the bottom point of this area, it climbed to 30 thousand dollars again.
Continuing the price structure in the band of 29,500 – 31,500 dollars BTC , has not yet come out of this area clearly. Testing the bottom of the region it priced in the past hours, BTC reacted from here and made an increase of $ 600. Can the pioneer of the market, which is still pricing below an important resistance in the short time frame, break this point and target $31,500 again? What’s the latest on the BTC chart?
Bitcoin (BTC) Chart Analysis
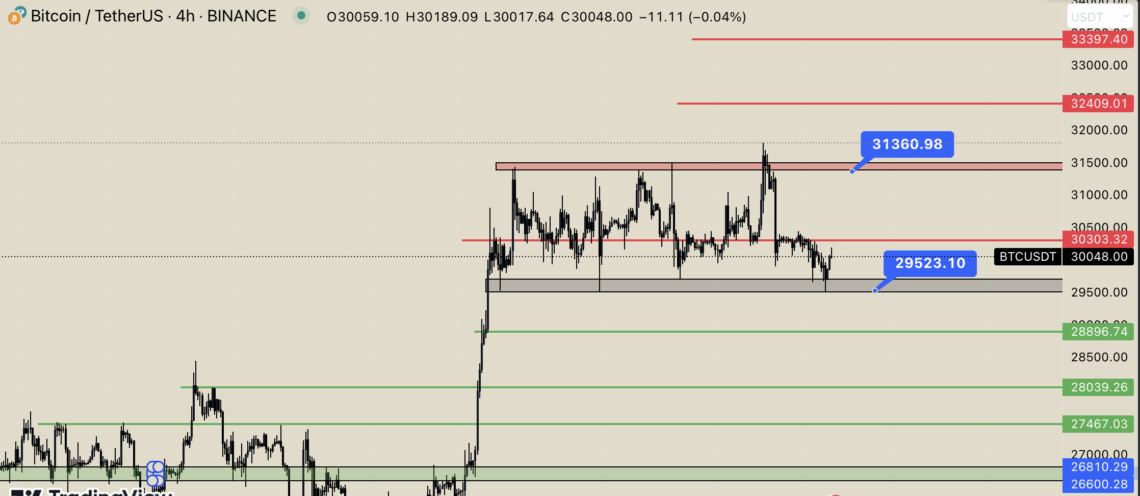
After the fundamental analysis in the industry was negative, BTC had come to $ 31,800 from $ 30,200. The leader of the market, which started to release from the $ 31,800 resistance, created panic by testing $ 29,500. Currently trading around $30,050, BTC can attack towards $32,400 – $33,380 and $34,000, respectively, if it stays above $31,360.
Continued indecision on the BTC side or FUD news from the crypto industry may continue to push the price down. Support zones to watch for BTC in this scenario are $29,520 – 28.900 – $28,040 and $27,460, respectively. Failure of the price structure to hold the 27,460 support could trigger a drop to $26,600.