
Bitcoin (BTC), which started its upward movement from $ 27 thousand 650, exceeded $ 28 thousand 500, how is the BTC chart progressing?
One of the processes that are actually risky for BTC, namely “ May “The month has come. Looking at the overall history of crypto May monthsactually Bitcoin ( BTC ) has not been very positive. BTC, which lost buyers while entering May or in May, seems to have repeated this action in 2023. BTC, with a monthly opening price of less than $ 30,000, is in the crypto investor worry brought it with it. How is the graph progressing for BTC, which has made big drops in this time frame of the past years?
Bitcoin (BTC) Chart Analysis
As of the writing of the news, BTC, which found buyers at $ 28,600, seems to have returned from $ 27,700. At these levels, the first important support point in BTC, where the buyers have regained dominance, is the $ 27,200 level. If the 27,200 support is not working, drops to $25,200 are possible for BTC. The leader of cryptocurrencies, who stepped into May weakly, must overcome many resistances in order to rise again.
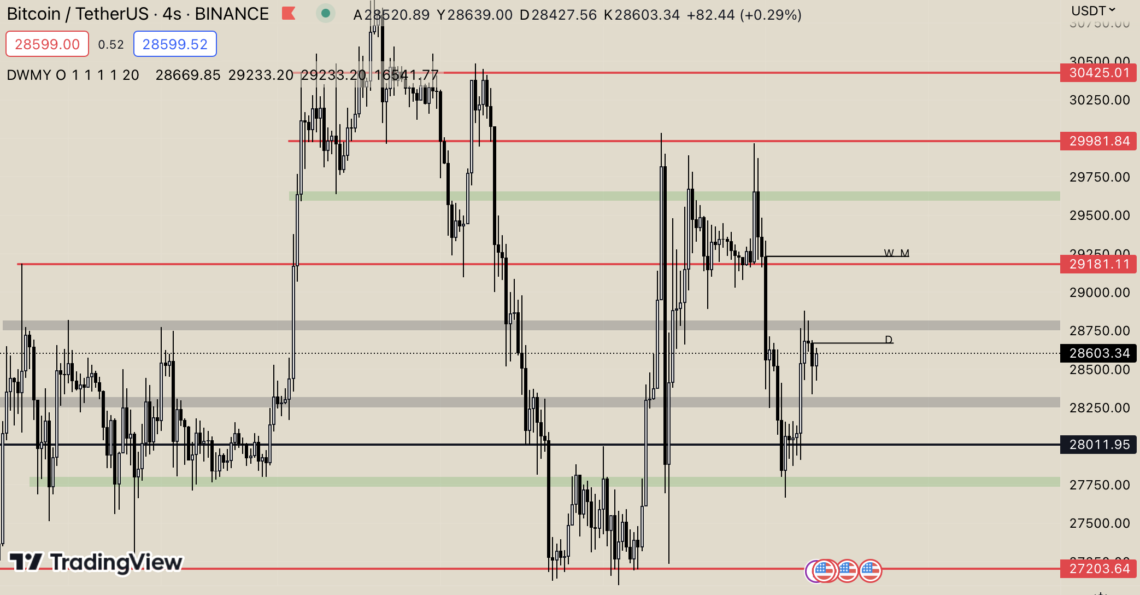
BTC, which is hovering below the weekly and monthly opening price, can break the $29,180 resistance, which could set the next stop at $30,000. In the case of $30,000, the dominance between buyers and sellers will be decisive. The side that wins this fight will gain a serious advantage in BTC’s direction.