
Bitcoin retests the key $28,500 support zone. BTC is rising and the bulls may aim for a clear move above the $30,600 resistance, according to technical analysis by NewsBTC’s Aayush Jindal.
Bitcoin Continues to Find Support
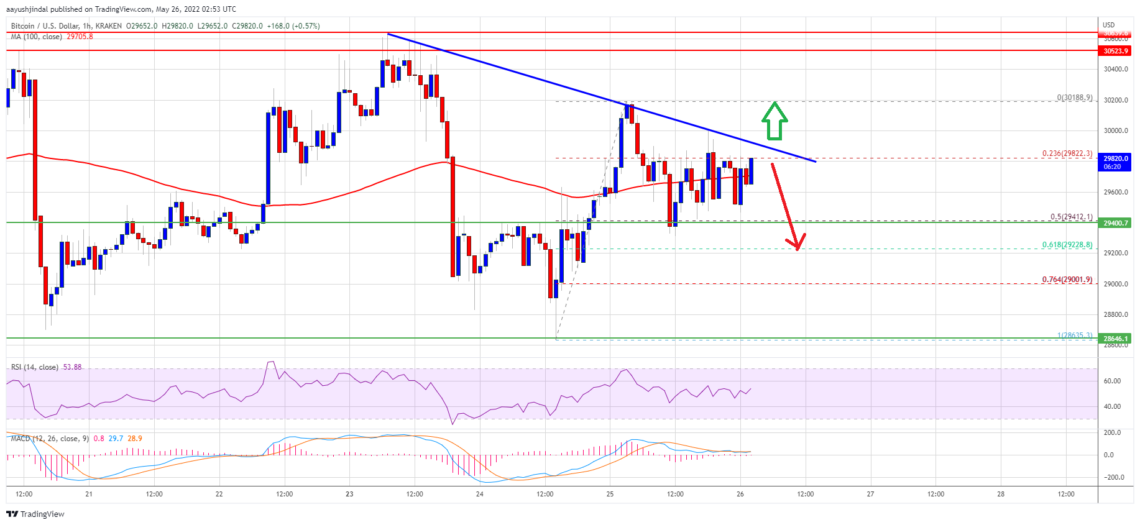
Bitcoin continued to trade well above the $28,500 support zone. There was a fresh increase starting at $28,635 and the price settled above $29,000. There was a break above the $29,500 resistance zone and the 100 hourly simple moving average. The price even climbed above the $30,000 level but there was no upside continuation. A top was formed near $30,188 and the price is now consolidating gains.
Bitcoin is now trading near the $29,800 level and the 100 hourly simple moving average. It tested the 50% Fib retracement level of the upward move from the $28,635 high to $30.188 high.
An immediate resistance is near the $29,950 level. There is also a key bearish trend line forming with resistance near $29,950 on the hourly chart of the BTC/USD pair. The next major resistance is near the $30,180 level. The main resistance is still near the $30,600 area. A clear move above the $30,600 resistance level could start a strong rise. In the stated case, the price could surpass the $31,200 resistance zone.
Will Bitcoin Drop?
Jindal says that if Bitcoin fails to break past the $30,180 resistance zone, it could start another decline. An immediate support is near the $29,400 level. The first major support is near the $29,250 level. This is close to the 61.8% Fib retracement level of the upward move from the $28,635 high to $30,188 high. A downside break below the $29,250 support could push the price down further. The main support is still near the $28,500 level.
What Do Technical Indicators Say?
- Hourly MACD – The MACD is slowly gaining momentum in the bullish zone.
- Hourly RSI (Relative Strength Index) – The RSI for BTC/USD is now above the 50 level.
- Major Support Levels – $29,400 followed by $29,250
- Major Resistance Levels – $29,950, 30,180 and $30,600