Bitcoin struggles above $30,000. According to technical analysis by NewsBTC’s Aayush Jindal, BTC must surpass $30,600 to move into positive territory.
Bitcoin Faces Resistance
Bitcoin found support near the $28,500 region in its drop yesterday. A low was formed near $28,600 and it started a fresh increase. There was a clear move above the $29,500 resistance zone and the 100 hourly simple moving average. The bulls even pushed the price above the $30,000 resistance zone. However, they are currently facing a hurdle near the $30,600 zone. There is also a major bearish trend line forming with resistance near $30,400 on the hourly chart of the
BTC/USD pair. A top was formed near $30,721 and it is now consolidating gains. Bitcoin is now trading above the 23.6% Fib retracement level of the upward move from the $28,590 high to $30,721 high. An immediate resistance is near the $30,400 level. The next major resistance is near the $30,600 level. A clear move above the $30,400 and $30,600 resistance levels
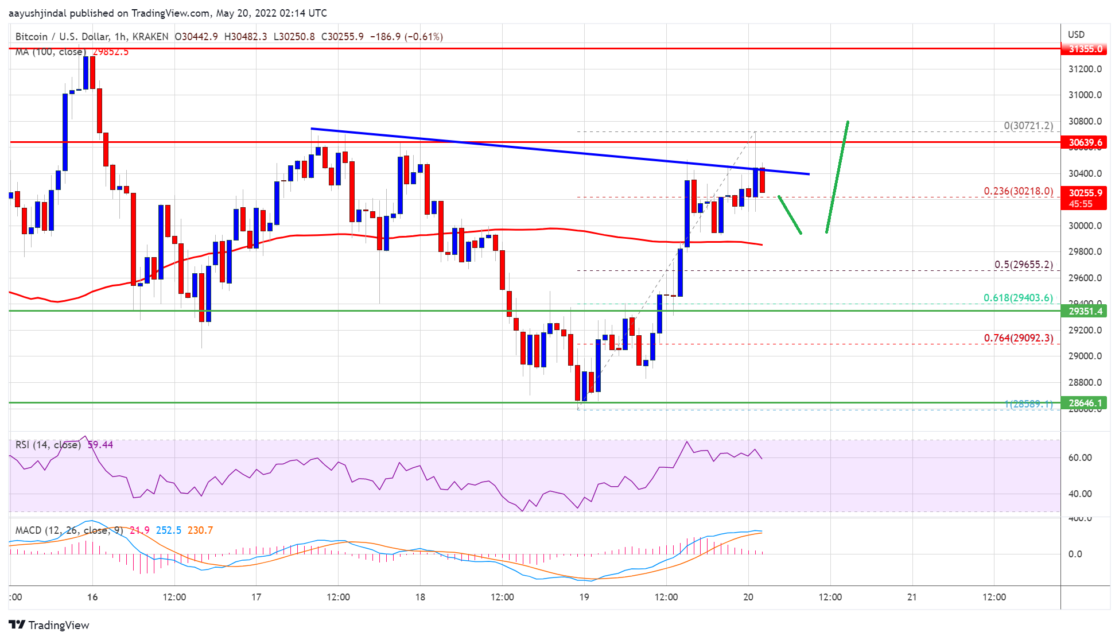
could start a fresh increase in the near term. The next key resistance could be near the $31,500 level, where the price could gain bullish momentum.
Will Bitcoin Drop?
Jindal says that if Bitcoin fails to gain momentum above the $30,600 resistance zone, it could start a fresh decline. An immediate support is near the $30,000 level. The first major support is near the $29,800 level and the 100 hourly SMA.
The next major support is near the $29,655 level. This is close to the 50% Fib retracement level of the upward move from the $28,590 high to $30,721 high. A downside break and a close below the $29,650 support could start another decline. In the stated case, the price could decline to the $28,500 level.
What Do Technical Indicators Say?
- Hourly MACD – The MACD is now slowly losing momentum in the bullish zone.
- Hourly RSI (Relative Strength Index) – The RSI for BTC/USD is now above the 50 level.
- Major Support Levels – $29,800 followed by $29,650
- Major Resistance Levels – $30,600, 31,200 and 31,500