
Bitcoin holds key support at $29,500. According to technical analysis by NewBTC’s Aayush Jindal, BTC needs to surpass the $31,500 resistance zone to start a massive increase in the near term.
Bitcoin Consolidates in One Range
Bitcoin attempted a fresh increase above the $31,200 and $31,500 resistance levels. However, the bears were active near the $31,500 zone and started a correction from there. There was a move below the $31,000 and $30,500 support levels. A bottom was formed near $29,848 and the price is now consolidating in a range. There was a recovery above the $30,000 resistance zone. The price settled above the 23.6% Fib retracement level of the recent decline from the $31,550 high to $29,848 low.
However, the price struggled near the $30,700 level. Bitcoin is currently trading below the $30,500 level and the 100 hourly simple moving average.
An immediate resistance is near the $30,400 level and the 100 hourly simple moving average. The first major resistance is near the $30,850 level. The main resistance is near the $31,250 level. There is also a major contrating triagle forming with resistance near $31,250 on the hourly chart of the BTC/USD pair.
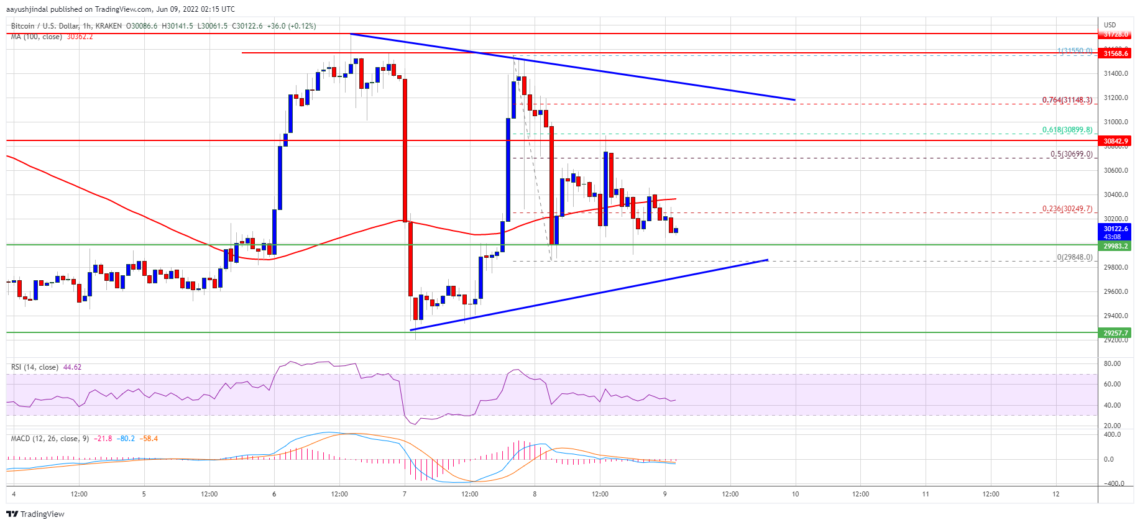
A clear move above the $31,250 resistance level could push the price higher. The next major resistance could be $32,000. More gains may require a trend change and a move towards the $33,200 level.
Will Bitcoin Drop?
Jindal says that if Bitcoin fails to break past the $31,250 resistance zone, it could start another decline. An immediate support is near the $30,000 level. The next major support is near the $29,850 level. The main support is still near the $29,500 area. A downside break below the $29,500 support might trigger another decline. In the stated case, the price could decline towards the $28,500 support zone in the near term.
What Do Technical Indicators Say?
- Hourly MACD – The MACD is now losing momentum in the bearish zone.
- Hourly RSI (Relative Strength Index) – The RSI for BTC/USD is currently just below the 50 level.
- Major Support Levels – $30,000 then $29,500
- Major Resistance Levels – $30,400, 30,850 and 31,250