Bitcoin, which has taken the wind behind it recently ( BTC), with $25,200 not exceeding drop to the trendstarted to pass.
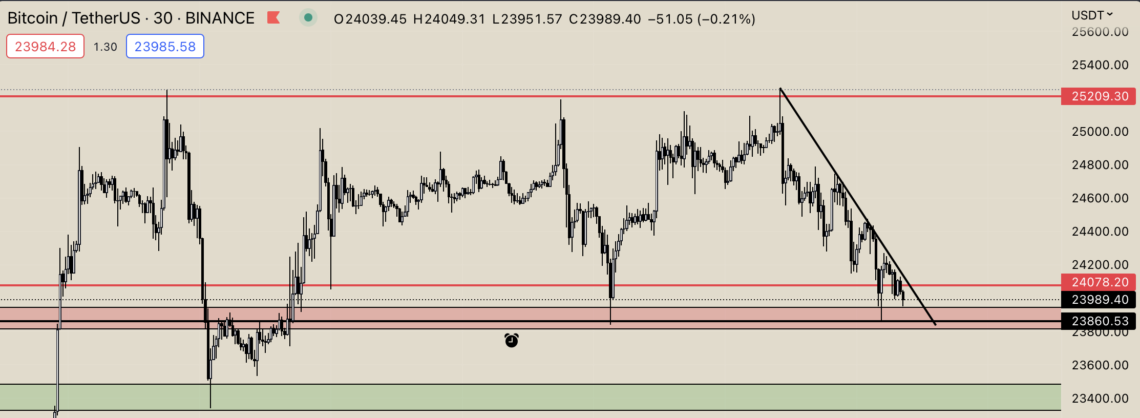
In terms of crypto money markets, it was almost a spring mood under the leadership of BTC. BTC is in a bearish trend after it failed to surpass the $25,250 price, which it tried three times. BTC, which is about $ 24,000 for the current price, may have come to the decision stage.
Bitcoin (BTC) Chart Analysis
BTC Looking at the graphical analysis in the 30-minute time frame, it can be said that the decision-making phase has been reached. having a strong resistance level in the previous period 23. 860dollar for now BTCserves as a support. BTC, 23. 860If it cannot find enough buyers at the dollar level 23. 480 The decline may deepen to the dollar. on the 30-minute chart falling trendconstituent BTC, with the breaking of this level again 25. 200can test dollar levels.

Bitcoin Dominance, What is the Latest Situation for Altcoins?
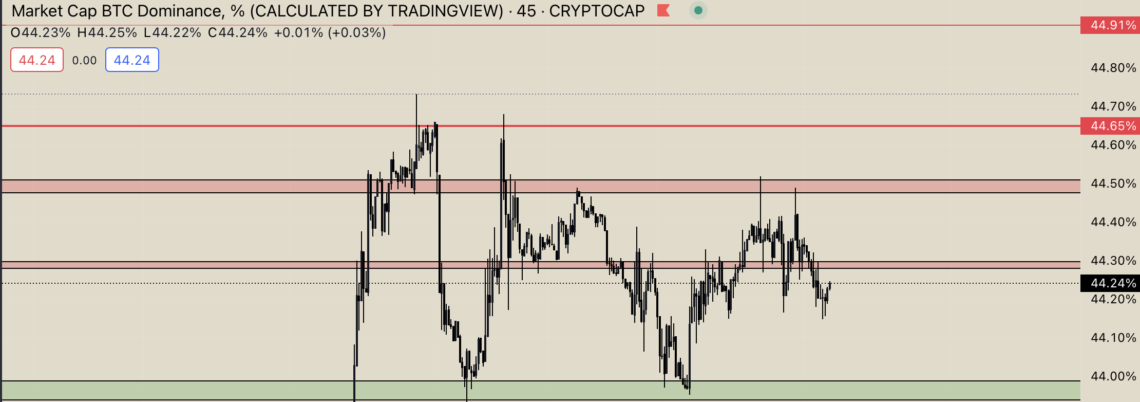
For current status BTC dominanceon the side percentage 44, 30Level resistance working as If this level is exceeded BTC dominancelevel of percentage 44, 50levels can be expected, in which case altcoinon the basis of fallspossible. BTC dominancelevel, percentage 44.05with a decrease in the level of altcoinfor the your risecan be opened.

Market Value Analysis for Bitcoin
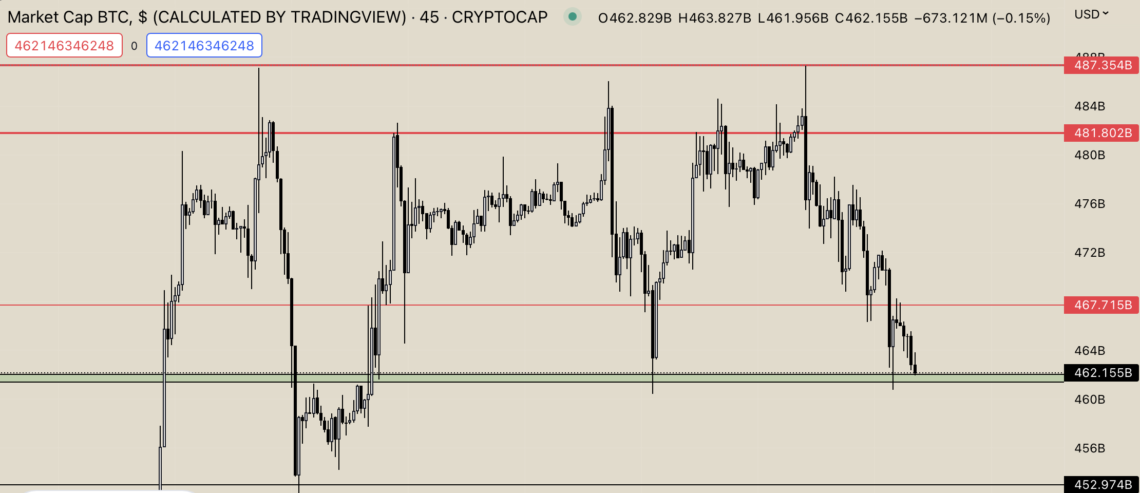
BTCLooking at the market value, for the current situation support Levelthe one which… 462 billion dollar market value is active. BTC price 25. 200If it reacts with sales larger than the dollar level, BTCThere was also a serious retracement in the market value. Your Ascensionsin order to continue 481 billiondollar market value may need to be earned. 462 billionwhen the dollar is below market value dropcan deepen.


