Bitcoin demand has fell to the lowest level of the last 27 months. Although past data show that such decreases may indicate the bottom levels in the price of Bitcoin, the demand for a long time has a greater risk of decreasing. On the other hand, the accumulation of BTC by large investors keeps the expectation of rise in the market alive.
What does the decline in Bitcoin demand mean?
The price of Bitcoin experienced a 25 %decrease from the $ 110,000 summit, and this decline coincided with the decrease in Bitcoin’s visible demand. As of March 17, the 30 -day average Bitcoin visible demand has fallen to -152,000 BTC, has reached its lowest level since December 2023.

Apparent demand measures the change of the amount held by long -term investors with the new BTC supply produced by mining. A negative visible demand value indicates that the new BTC supply in the market is more than long -term investors, and this can create downward pressure on the price of bitcoin. However, according to the past data, such decreases coincided with the periods when Bitcoin determined the bottom levels and then became rising.
Bitcoin accumulation of whales are increasing
Bitcoin demand indicators give a slimming signal, while the BTC accumulation of whales has reached the highest level since March 2021. The purchase of BTC by major investors shows that despite the fluctuations in the market, long -term confidence continues.
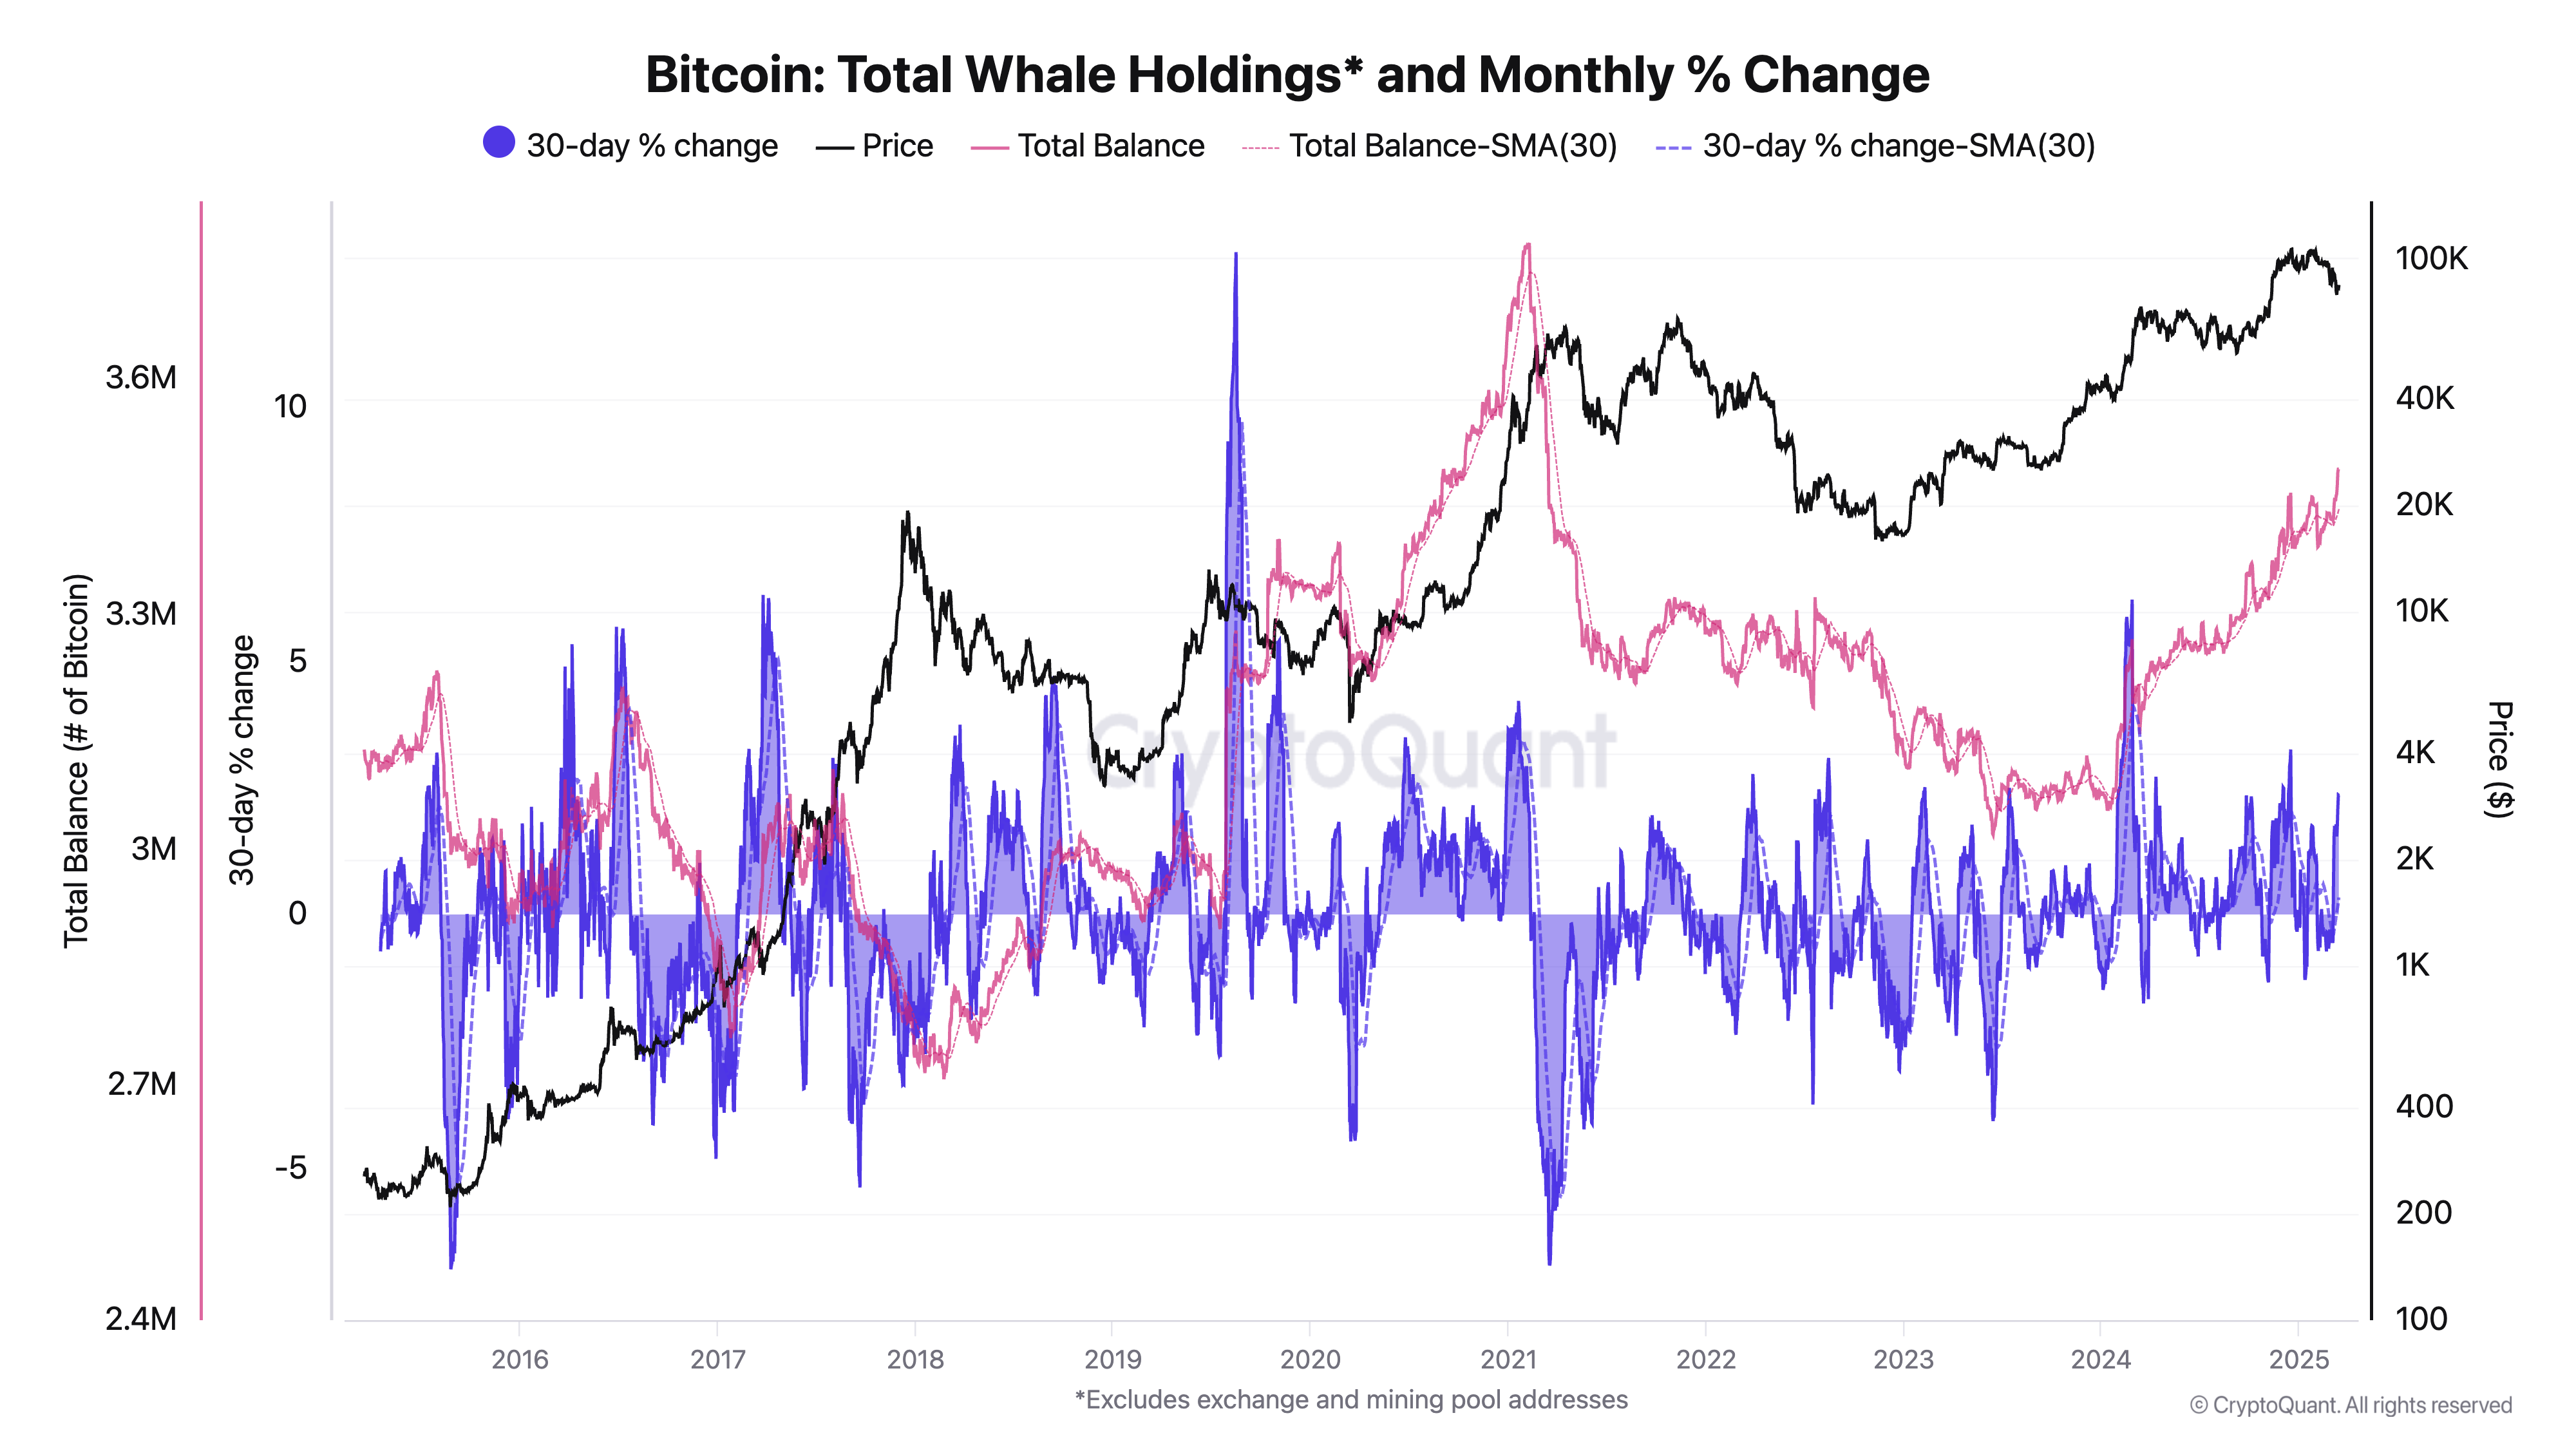
Historically, the periods when whales have accumulated BTC were usually experienced before major price increases. For example, when the BTC fell to $ 3,200 in 2019, whales accumulation accelerated and a long -term bull market had begun. Similarly, in 2020, after the whale purchases accelerated, the BTC exceeded $ 20,000 and entered a large rally. Currently, the aggressive BTC purchase of whales, Bitcoin may be in the medium -cycle accumulation phase and may be preparing for a new upward trend.
Technical view: BTC protects the rise trend
Bitcoin price movements show that a parabolacic rise trend continues in the weekly graph. While the BTC maintains its 80,000 dollars as a strong support, the levels of $ 90,000-100,000 stand out as the main resistance points.
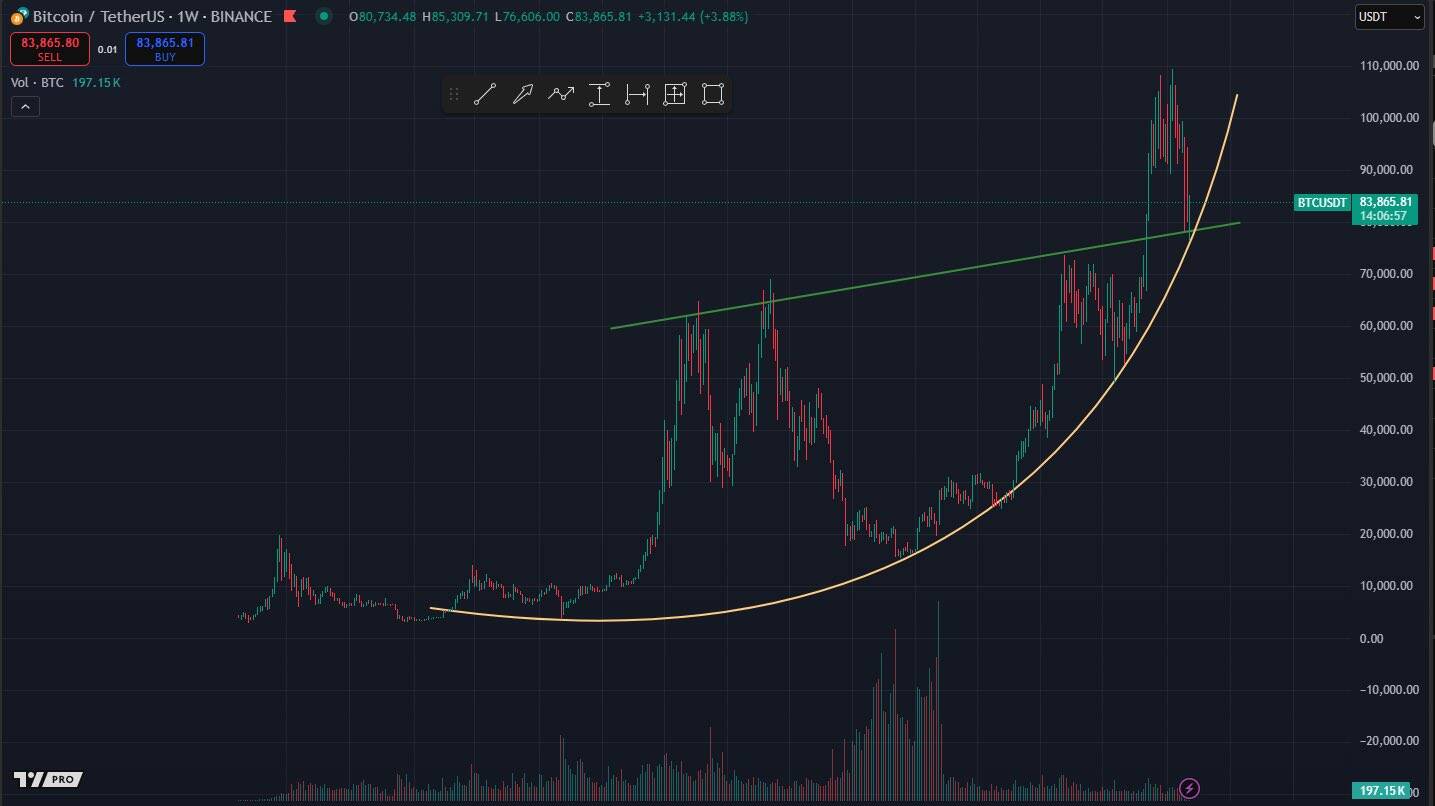
According to technical analysis, if the BTC exceeds $ 90,000, it can re -test $ 100,000. However, if it decreases below 80,000 dollars, a longer consolidation process may be experienced.