
Bitcoin and selected altcoins have attempted a relief rally. However, Rakesh Upadhyay notes that most breakouts are closed well below the 20-day moving average. Can the recovery in Bitcoin and major altcoins continue in the near term? To find out, his analyst studies the charts of the top 10 cryptocurrencies. We also prepared Rakesh Upadhyay’s analysis for our readers.
An overview of the crypto market
cryptocoin.com As you can follow, the crypto markets have been in a strong bearish phase for the past few months. But analysts at JPMorgan Chase expect that to change. They also anticipate a substantial increase from current levels. Analysts point to the increasing share of all stablecoins in the total crypto market for bullish outlooks.
Meanwhile, individual traders, unaffected by the current drop, are adding Bitcoin to their portfolios. The number of wallet addresses holding Bitcoin increased by 13,091, reaching a record level of 865,254. Similarly, the number of addresses holding around 0.1 BTC has also witnessed a sharp increase over the past 10 days, according to Glassnode data.
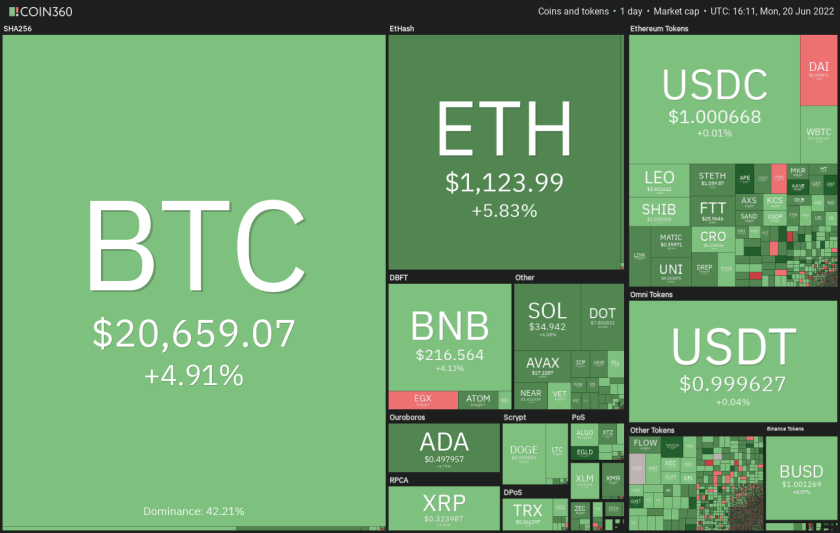 Daily cryptocurrency market performance. Source: Coin360
Bitcoin’s sharp recovery from the June 18 drop indicates strong buying at the lower levels. According to Whalemap, this has led to the formation of a new ‘whale level’ that could act as short-term support. Now it’s time for analysis…
Bitcoin, ETH, BNB, ADA and XRP analysis
Leading crypto Bitcoin (BTC)
BTC dropped below $20,000 on June 18. However, it rebounded equally sharply on June 19, pointing to aggressive buying at lower levels. If the bulls sustain the price above $20,000, they are likely to improve sentiment. Otherwise, they are likely to attract more buyers.
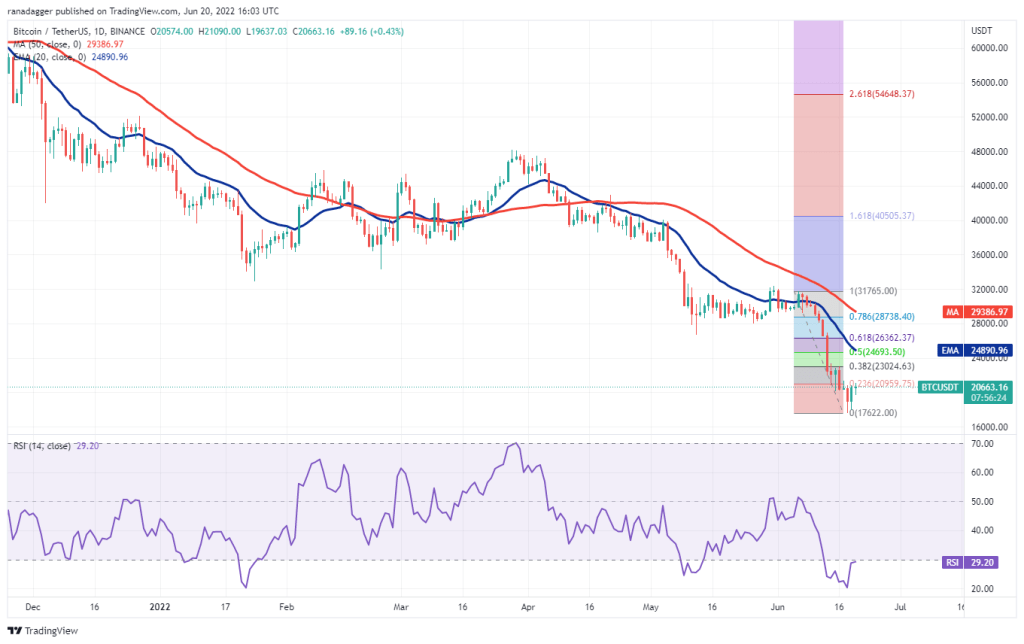
It is possible for BTC to rise to the 38.2% Fibonacci retracement level of $23,024 first and then to the 20-day exponential moving average (EMA of $24,890). On the other hand, bears are likely to defend this area with all their might.
If the price drops from this zone, sellers will make another attempt to push Bitcoin (BTC) below $20,000. A break and close below $17,622 is likely to start the next leg of the downtrend.
Alternatively, if buyers push the price above the 20-day EMA, it will signal a potential change in trend. Bitcoin can then rise to the 50-day simple moving average (SMA) ($29,386), where the bears can form a strong defense.
Ethereum (ETH)
Ethereum dropped below the psychological level of $1,000 on June 18. This shows that the downtrend remains intact. A minor positive is that the bulls are buying the dip as seen from the long tail on the candlestick of the day.
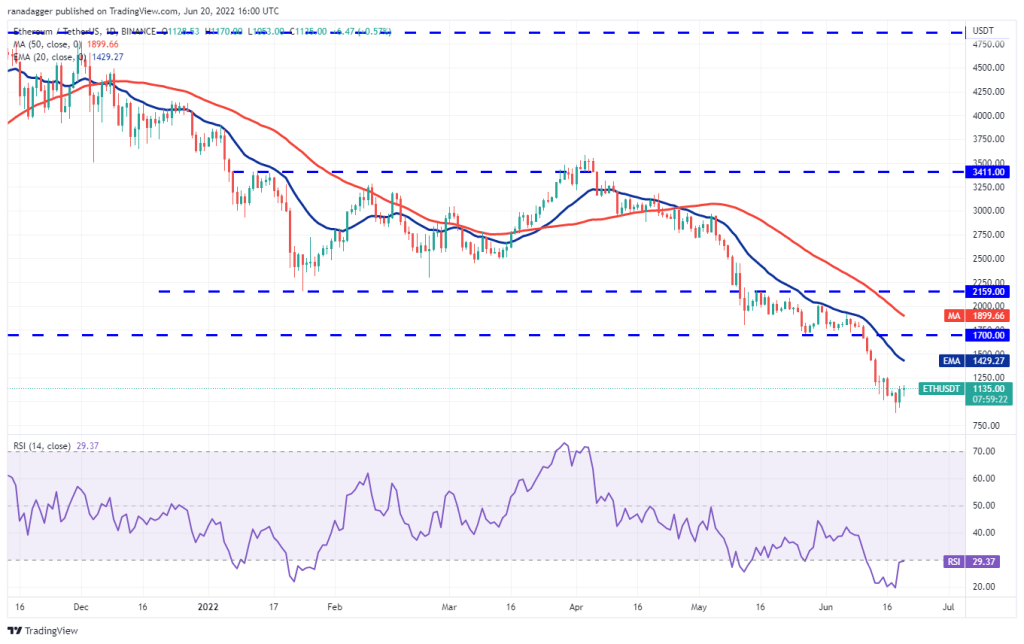
Buyers continued the momentum on June 19 and pushed the price above $1,000. ETH is likely to rally to $1,250 and then to the 20-day EMA ($1,429). This remains critical resistance to watch out for.
If the price breaks from the current level or the 20-day EMA, it indicates that the bears are active at higher levels. Sellers will then try to push ETH down to the intraday low of June 18 at $881. A break and close below this level could signal a resumption of the downtrend.
Binance Coin (BNB)
BNB broke below the strong support at $211 on June 18 and closed. But the bears did not take advantage of this advantage. This indicates that lower levels continue to attract buyers.
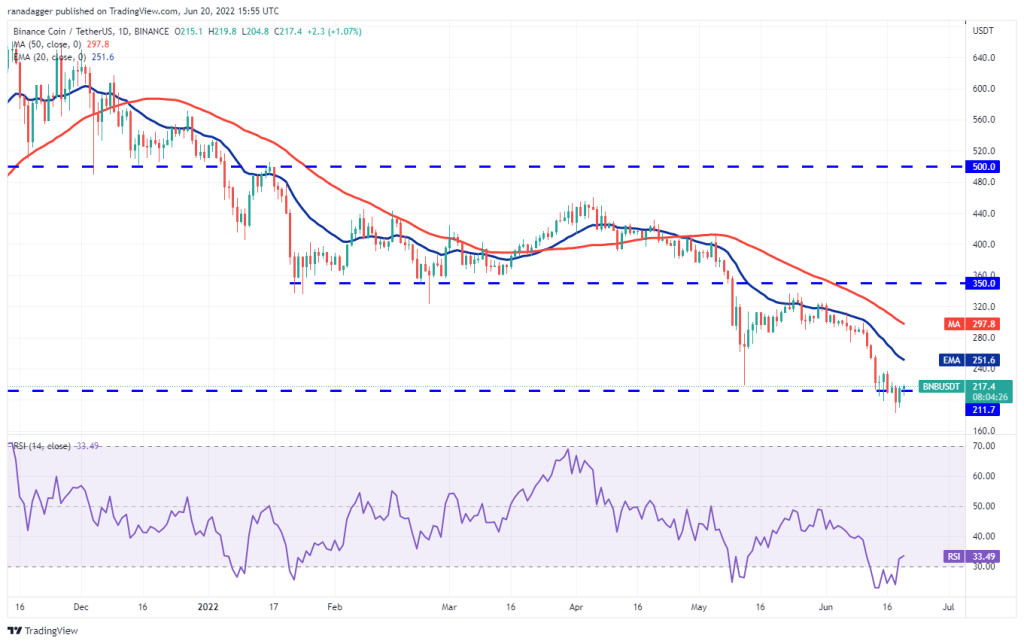
The bulls pushed the price back above the $211 breakout level on June 19. If buyers hold this level, it will suggest that the June 18th drop could be a bear trap. If the bears rush to close their positions, they are likely to cause a short squeeze. This could push BNB towards the 20-day EMA ($251). If the bulls break this hurdle, BNB is likely to rise to the 50-day SMA ($297).
Contrary to this assumption, if the price drops from the current level and dips below $211, it means that the bears are selling on minor rallies. The bears will then try to push BNB below $183 and continue the downtrend.
Cardano (ADA)
The bulls once again successfully defended the $0.44 to $0.40 zone on June 18. This started a recovery on ADA reaching the 20-day EMA ($0.52).
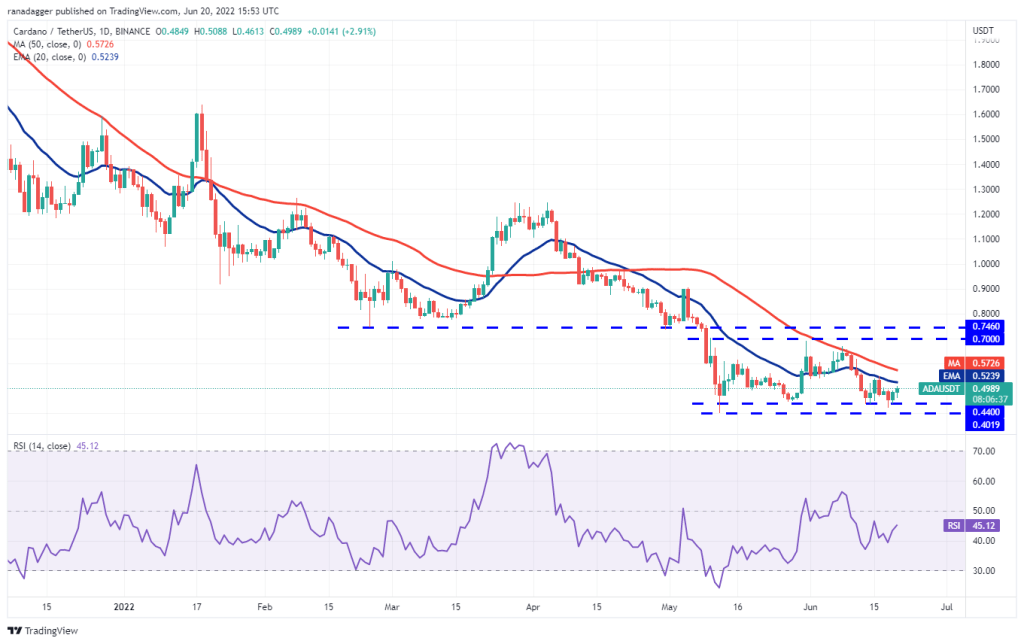
If the bulls propel the price above the moving averages, ADA could rise to the overhead resistance zone between $0.70 and $0.74. So the bears are likely to defend this area with all their might.
If the price drops, ADA is likely to be stuck in a wide range between $0.40 and $0.74 for a few days. The next trend move could begin after the bulls push the price above $0.74 or the bears pull the ADA below $0.40.
Ripple (XRP)
Ripple fell below $0.29 on June 18. But the bears did not take advantage. This indicates that sales are drying up at lower levels.
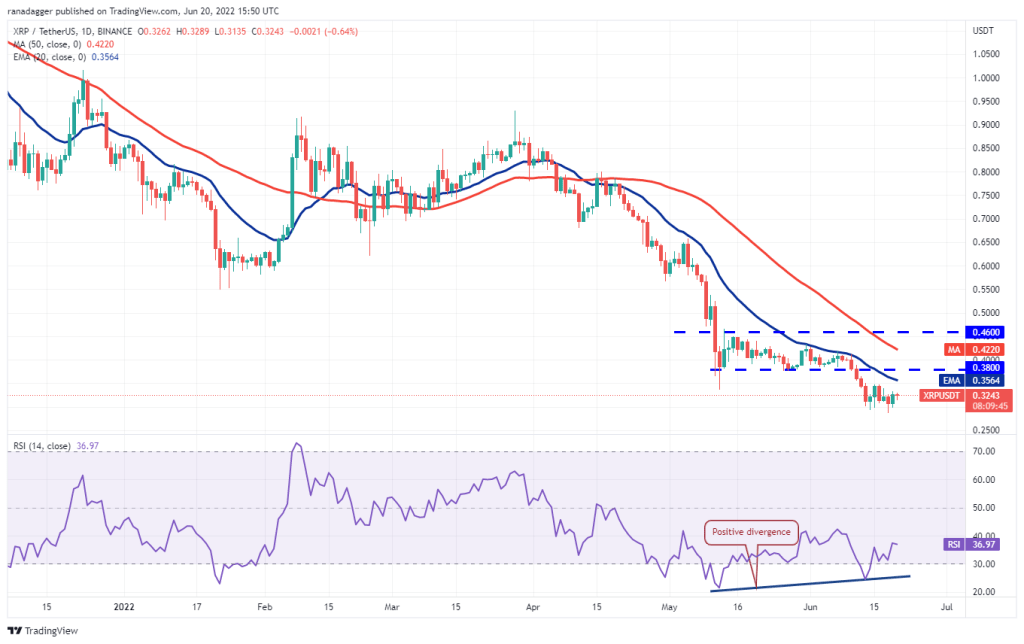
It is possible for the bulls to try to push the price into the overhead resistance zone between the 20-day EMA ($0.35) and the $0.38 breakout level. On the other hand, bears are likely to defend this area aggressively. However, if the bulls clear their way, XRP could rally towards the overhead resistance at $0.46.
This positive view may be invalidated if the price falls from the current level or overhead zone. The bears will then make another attempt to break and sustain the price below $0.29.
SOL, DOGE, DOT, LEO and AVAX analysis
Left (LEFT)
Solana is in a downtrend. However, the bulls are trying to recover. The price has reached the 20-day EMA ($36), an important level to watch out for.
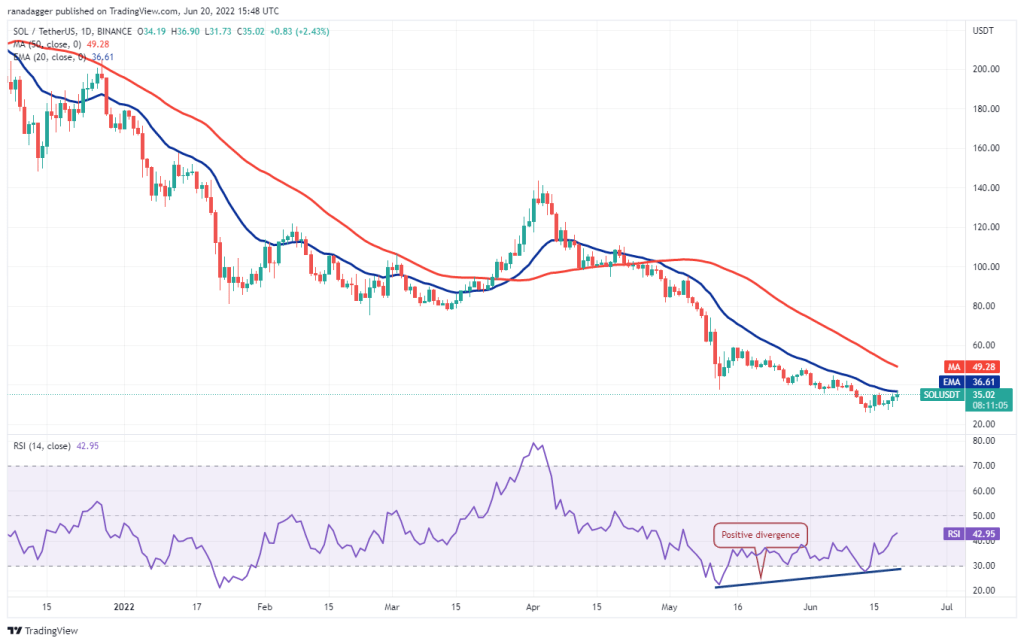
The positive divergence in the relative strength index (RSI) indicates that the bearish momentum may weaken. If the buyers price rises above the 20-day EMA, a rise to the 50-day SMA ($49) for the SOL is possible. This level can act as a resistance again. But if the bulls break this hurdle, the next stop is likely to be $60.
On the contrary, if the price drops from the current level, it will show that the bears continue to vigorously defend the 20-day EMA. The bears will have to pull the SOL below $25 to signal the start of the next leg of the downtrend.
Dogecoin (DOGE)
The bears pulled DOGE below psychological support at $0.05 on June 18. However, they were unable to sustain lower levels. This indicates that the bulls are buying on the dips.
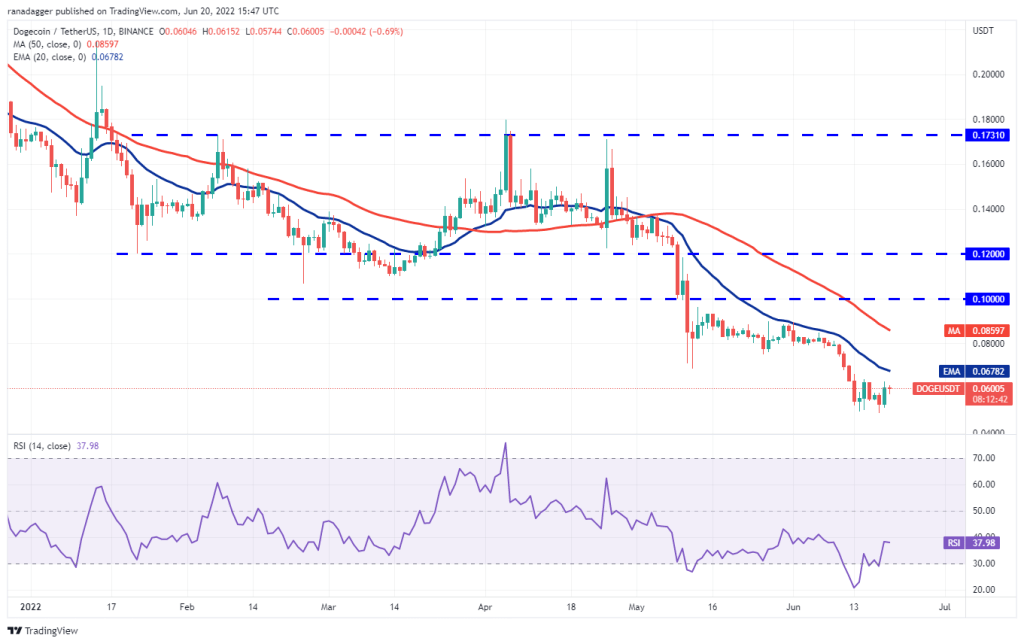
Buyers will try to push the price towards the 20-day EMA ($0.07), which can act as a stiff barrier. If the price drops from this level, it will suggest that the bears remain in command. Sellers will then make another attempt to break and sustain the price below $0.05. If successful, DOGE is likely to drop to $0.04.
Conversely, a break and close above the 20-day EMA will be the first indication that the bulls are in a reversal. DOGE is likely to rally to the 50-day SMA ($0.09) later, which will again act as a stiff resistance.
Polkadot (DOT)
The bears tried to push Polkadot below the support at $6.36 on June 18. But the bulls held their ground. Strong buying lower levels pushed the price above the $7.30 break on June 19.
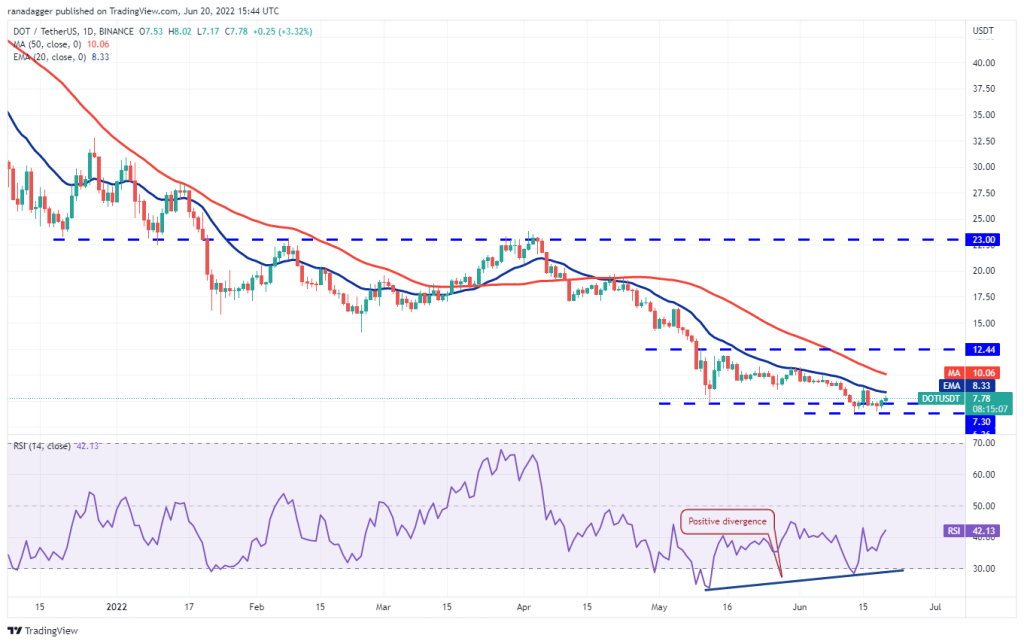
The bulls will try to push the price above the 20-day EMA ($8.33). If they are successful, it will suggest the start of a sustained improvement. It is possible for the DOT to rise later to the 50-day SMA ($10.06) and then to the overhead resistance at $12.44. The positive divergence in the RSI also points to a possible aid rally.
Contrary to this assumption, if the price drops from the 20-day EMA, the bears will try to push the DOT back below $6.36 and continue the downtrend. The next support on the downside is $4.23.
UNUS SED LEO (LEO)
LEO broke below the support line of the descending channel on June 18. However, the long tail on the day’s candlestick indicates aggressive buying at the lower levels.
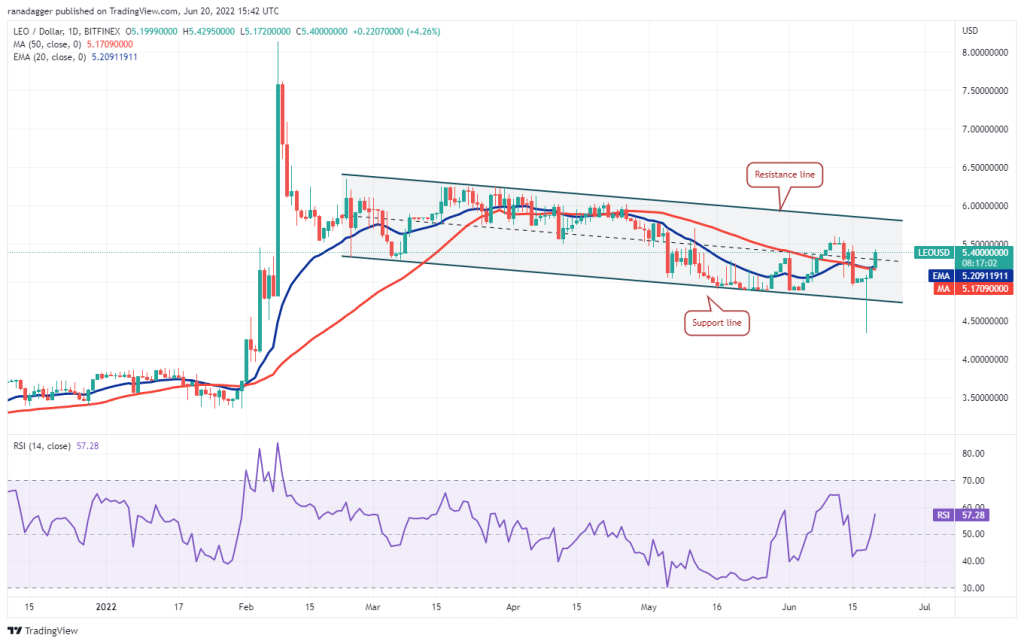
The bulls continued their momentum and pushed the price above the moving averages on June 20. If LEO stays above the moving averages, the next stop is likely to be the resistance line of the channel. Buyers will have to push the price above this level to indicate the start of a new bullish move.
Contrary to this assumption, if the price drops below the resistance line, it will indicate that the bears are defending the level aggressively. This is likely to keep LEO on the channel for a few more days.
Avalanche (AVAX)
Avalanche broke below the support at $14.50 on June 18. But the bears failed to sustain lower levels. The bulls are attempting a recovery that could reach the 20-day EMA ($20) on June 20.
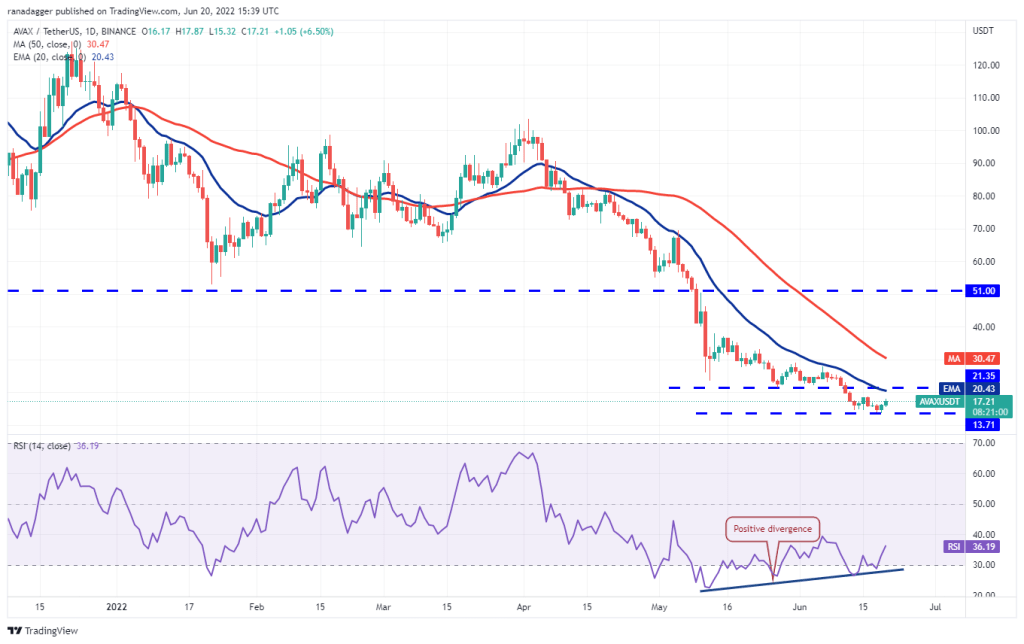
If the price drops from the 20-day EMA, it indicates that the bears remain in control and are selling on rallies. The bears will then make another attempt to sink the price below $13.71 and resume the downtrend. The next support on the downside is $13.
Conversely, if the bulls push the price above the 20-day EMA, it suggests that the bears may be losing control. AVAX could then attempt a rally to the 50-day SMA ($30), where the bears could pose a challenge again.