Bitcoin (BTC) was bearish on Thursday as investors moved to take profits following yesterday’s price surge. The bulls are currently breathing just below $21,000. New analysis shows buyers need time before the next move.
Bitcoin stalls at $21,000
Bitcoin bulls prefer to secure their gains as the price drops from a high above $21,000. In yesterday’s rally, BTC price peaked at $21,022. However, it dropped $20,430.65 earlier today. This decline in BTC/USD comes as previous bulls chose to cash out their gains and abandon positions after a move to a five-week high.
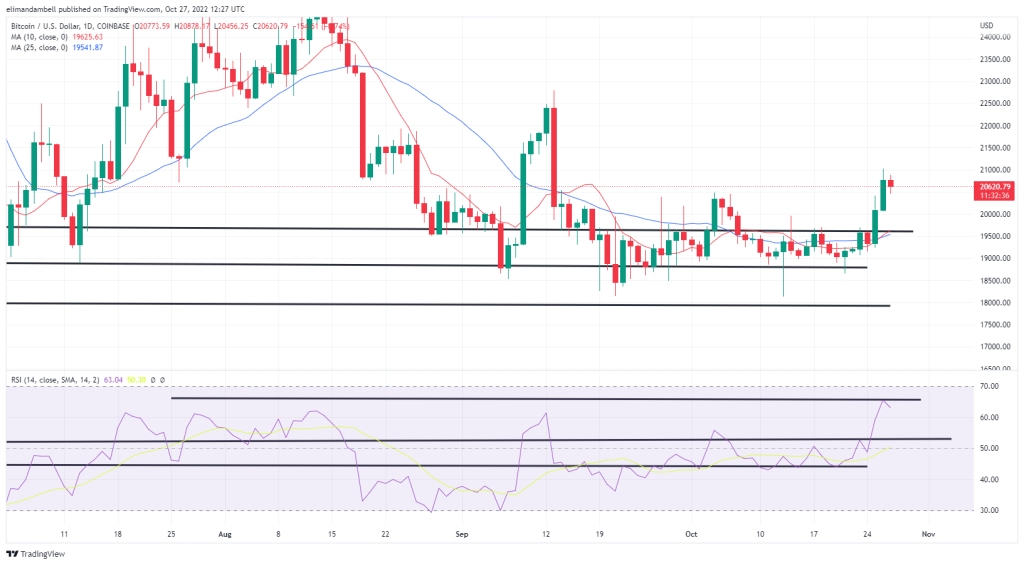
As in the chart, the drop also came when the 14-day RSI collided with a resistance level. Price strength has risen to its highest level since March. However, the index could not exceed the ceiling of 66.00. Momentum is still bullish as both the 10-day (red) and 25-day (blue) moving averages continue to rise. This also acts as a positive sign for the remaining bulls.
Ethereum tops the green board
Ethereum also fell in today’s session. The downward momentum coincided with the marginally rising US dollar. ETH was at the top of the list of top-paying altcoins at one point on October 26. It hit an intraday low of $1,517.05 earlier today, after Wednesday’s top of 1,584.64. Like Bitcoin, ETH bulls probably chose to close positions not only in response to dollar gains, but also to make a profit.
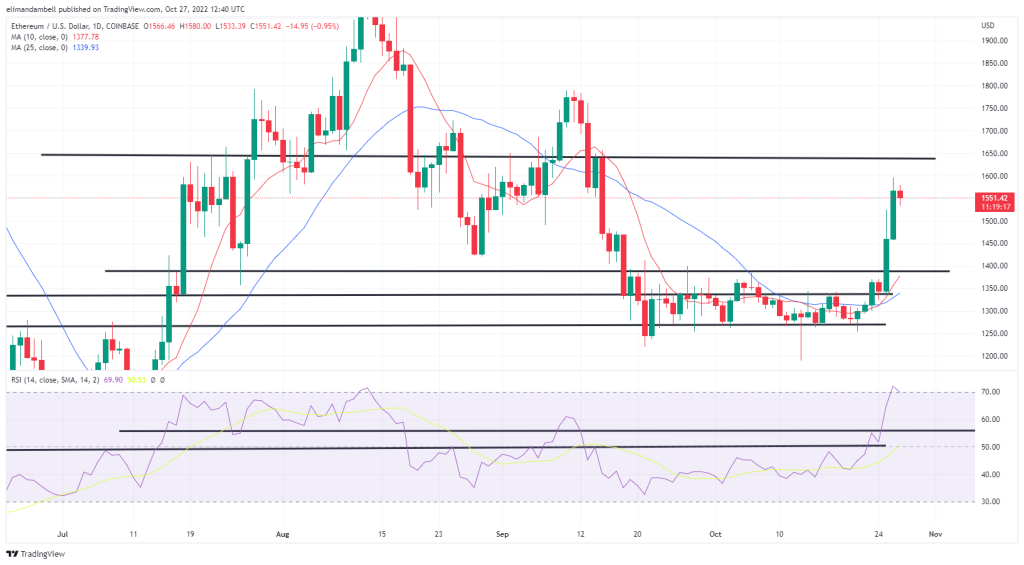
Yesterday’s move saw ETH reach its highest point since Sept. 15 and break out of a key resistance level in the process. Bulls waiting for the $1,385 ceiling to break in this way were probably the first to close positions, which led to earlier declines. Despite this, Ethereum has since recovered from these lows. It is currently trading around $1,550.
XRP reaches golden cross as Bitcoin rises
The golden cross is generally regarded as a potential indicator for large price increases. XRP’s 50-day moving average has crossed its 200-day moving average to form a bullish golden cross. RSI and MACD indicators also currently support buyers.
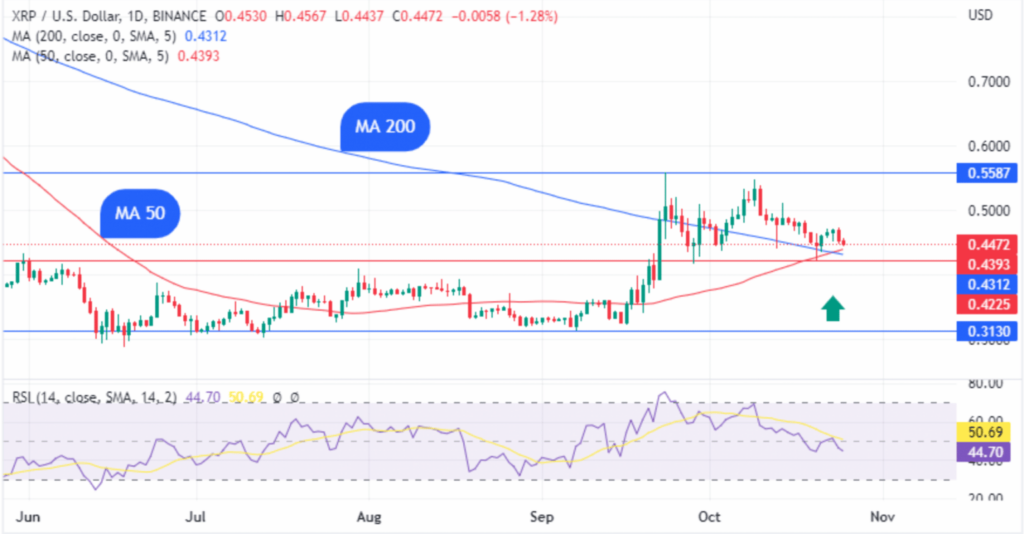
Golden cross has appeared on XRP charts a few more times in the past. It last occurred on July 17, 2021. This was followed by a 176% price rally. XRP peaked at $1.41 before turning the course down. cryptocoin.com As you follow, Ripple is currently dominating the litigation process with the SEC. This keeps investors afloat due to the possibility of new positive news.