The bitcoin and altcoin market rebounded strongly last month after a serious correction in the second quarter. Currently trading above $23,300, BTC recorded close to 20% gains last month. In the rest of the article, let’s take a look at the technical developments to watch as we move forward in August.
August map of Bitcoin and altcoins after a strong July
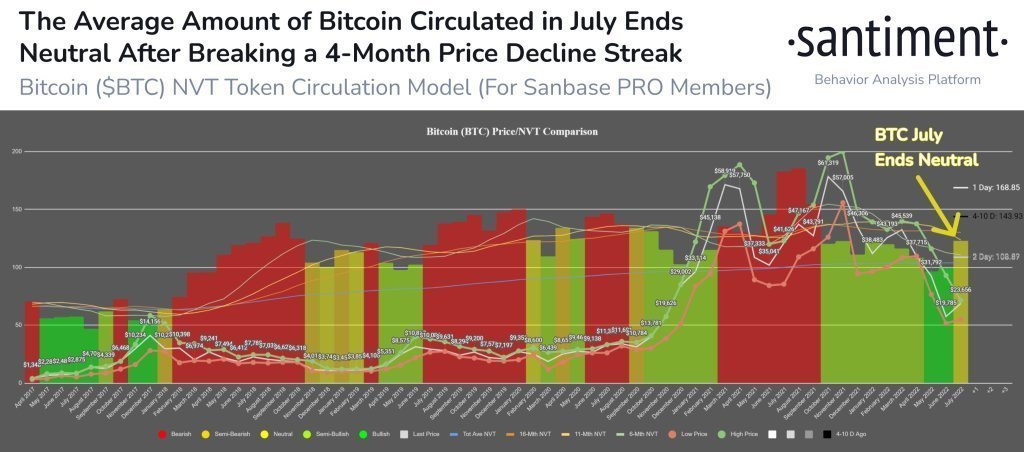
After numerous successful attempts, the Bitcoin price remained above $20,000. The big question now is where does Bitcoin go next. According to on-chain analytics firm Santiment reports:
Bitcoin gained +18% in July after the NVT pattern saw a price bounce at the end of the increasing bullish divergence in May and June. With a neutral signal, August could move in either direction as prices rise and token circulation decreases slightly.

Mike McGlone shared a positive outlook
On the other hand, Bloomberg senior commodity strategist Mike McGlone says the risk-reward is leaning significantly in favor of Bitcoin. The senior analyst recently wrote:
July marked the highest decline in Bitcoin (BTC) history, its 100 and 200-week moving averages, which had implications for its recovery. For one of the biggest bull markets in history, I see risk versus reward leaning favorably.
July marked the steepest discount in #Bitcoin history to its 100-and 200-week moving averages, with implications for it to recover. I see risk vs. reward tilted favorably for one of the greatest bull markets in history pic.twitter.com/SFd22sm2nz
— Mike McGlone (@mikemcglone11) July 30, 2022
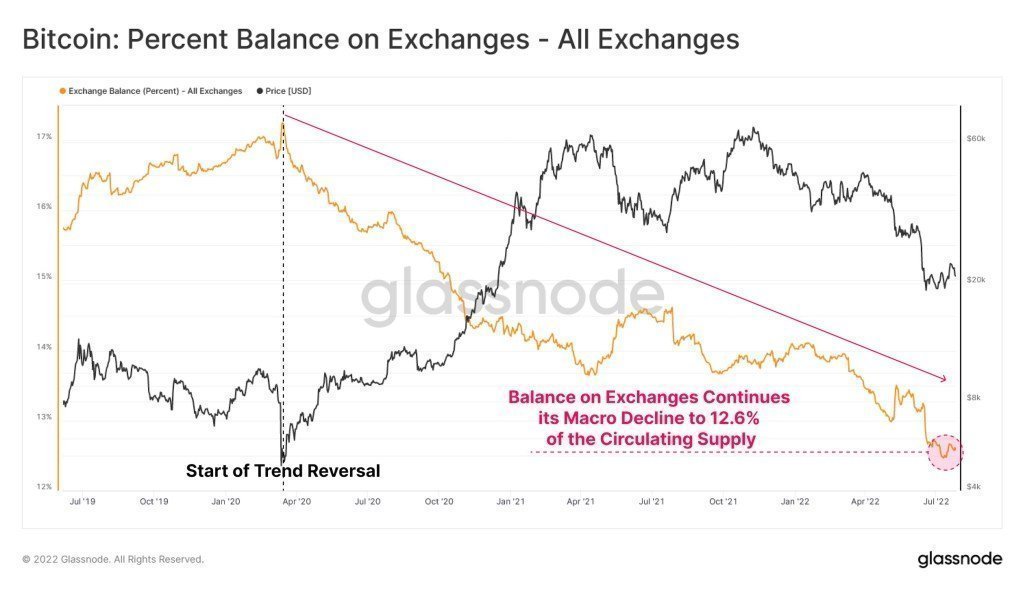
On the other hand, data from Glassnode also shows that the Bitcoin balance on exchanges is constantly on the decline. The BTC balance on exchanges has now reached 12.6% of the total circulating supply.

Despite the Fed’s rate hike, the US stock market performed strongly in July. Some market analysts are optimistic that the market will continue to rise from here. According to popular Twitter analyst Lark Davis:
The Nasdaq 100 lights a rising candle! This could bode well for stocks, and when stocks do well, crypto will move forward.
Nasdaq 100 putting in a bullish engulfing candle!
This could bode well for equities, and when equities do well so does #crypto! pic.twitter.com/4aSvGuDWob
— Lark Davis (@TheCryptoLark) August 1, 2022
Edward Moya says crypto winter is over
Edward Moya, an analyst at market research firm Oanda, believes the crypto winter is already over. The “fear and greed” index, which is one of the indicators supporting this, has turned a little green again after the recent sales.
Bitcoin Fear and Greed Index is 33. Fear
Current price: $23,228 pic.twitter.com/Bi6UUhbv0E— Bitcoin Fear and Greed Index (@BitcoinFear) August 1, 2022
Edward Moya’s analysis cryptocoin.comas discussed in this article.
What technical analysis says for Bitcoin
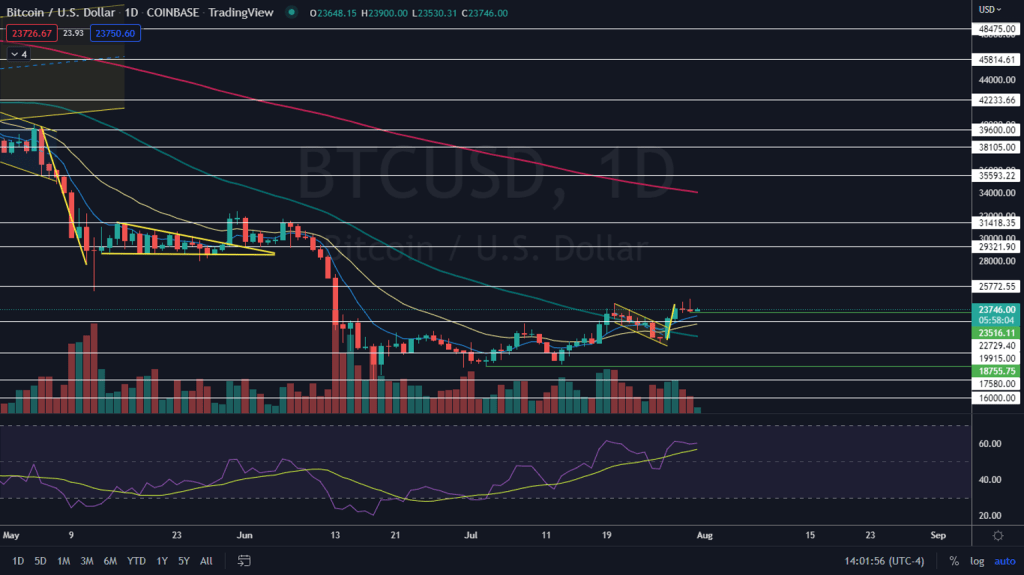
The inner bar formation forming on the Bitcoin chart shows a bullish trend. Sunday’s candle is pressing near the bottom of Saturday’s main bar. However, there is a possibility that this situation will put the bulls on a pause. Technical analyst Melanie Schaffer reveals the critical levels waiting for investors in this formation:
- If Bitcoin breaks below Saturday’s trading range at below-average volume, the model will be invalidated. If there is a drop in volume, investors can watch Bitcoin make HL above $20,715. This shows that the uptrend is solid.
- If Bitcoin breaks out of the inside bar pattern with a bullish, Saturday’s low will serve as the next low in the uptrend.
- Bitcoin is likely to form a bull flag with the pole formed between Wednesday and Thursday and the flag formed in the following 24-hour trading sessions. Attentive investors may decide to take a position that the bull flag pattern will play out until Bitcoin breaks out of the pattern due to the upper wicks on the daily candlesticks on Friday and Saturday.
- On the other hand, if Bitcoin breaks below the eight-day exponential moving average, the bull flag is likely to be invalidated.
As a result, here are the levels to watch out for, according to the analyst:
Bitcoin has resistance above $25,772 and $29,321 and support below $22,729 and $19,915.


