While the bear tendency in the Bitcoin market strengthens, the flow coup between the negative stock market (IFP) and weak technical indicators increase the risk of decrease.
Is it entering the Bitcoin bear market?
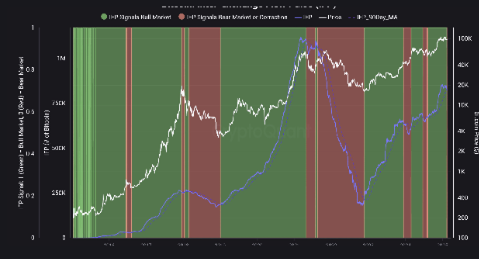
Bitcoin’s flow coup between stock market (IFP) measures BTC flow between spot and derivative exchanges and provides important information about investor sensitivity.
- The negative IFP indicates that investors have closed their positions, reduce their leverages or prepare to sell.
- Historically, negative IFP data has been a harbinger of a decrease in BTC price or long -term bear markets.
For example:
- At the beginning of 2018, when the IFP moved to the negative region, Bitcoin entered a long -term bear market.
- In mid -2021, when this metric returned to negative, Bitcoin experienced a harsh correction and investors reduced their leveraged positions.
The latest data show that the IFP has returned to negative and has increased the possibility of recurrence of previous decline cycles. However, the effect of this situation may occur in different ways:
- Some negative IFP periods are limited to short -term corrections;
- Others led to long -term decline trends.
Bitcoin’s momentum deficiency can trigger decrease
Bitcoin has difficulty in gaining upward acceleration and traded at $ 97,605. Technical indicators show that care should be taken:
- 50 -day simple moving average (SMA): $ 98,815.
- 200 -day SMA: provides a long -term support point at $ 80.002.
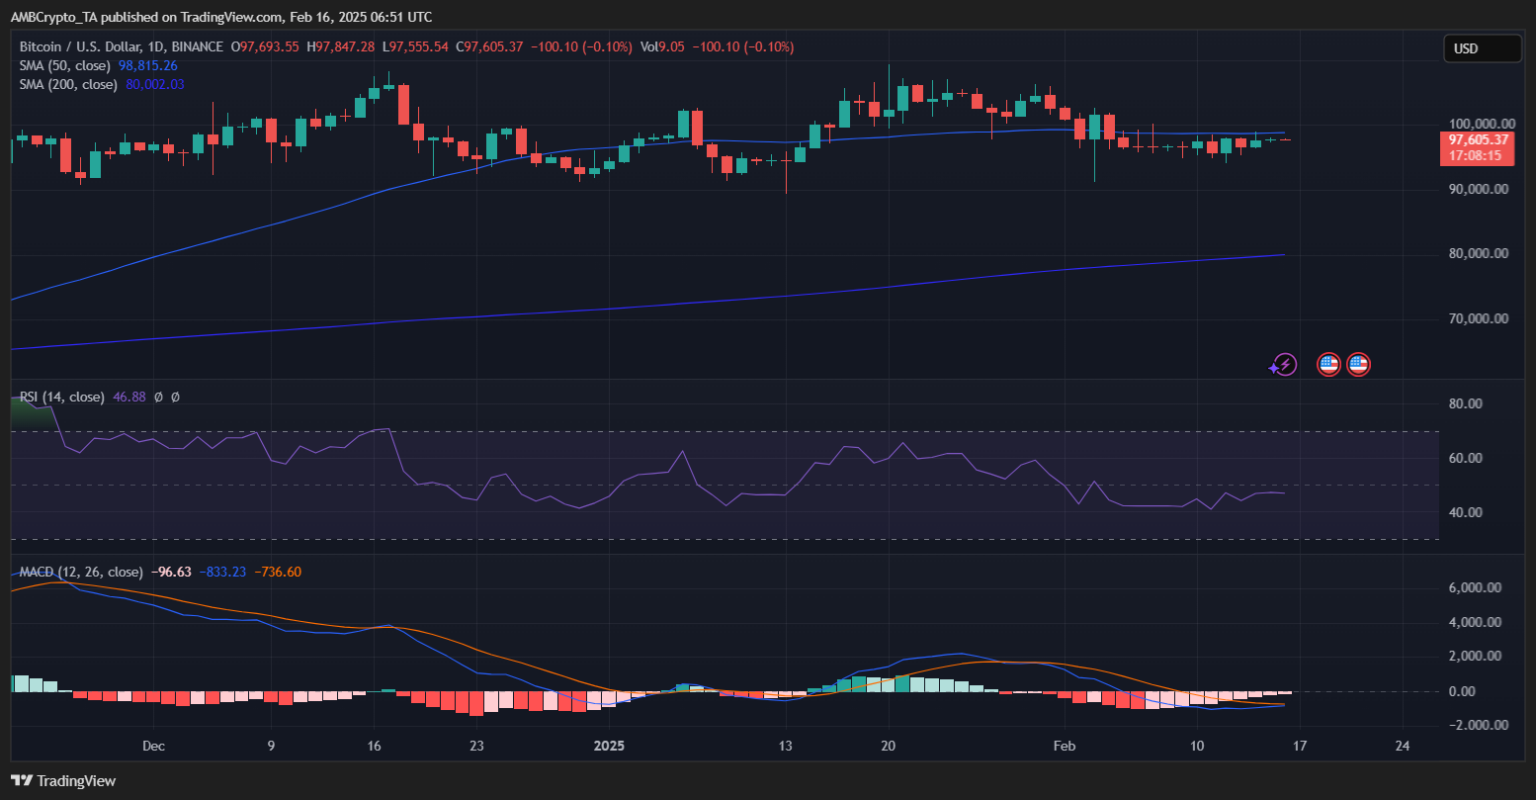
The relative power index (RSI) points to 46.88 levels, ie below 50, which is the neutral region and indicates weak purchase pressure. The MACD indicator remains in the negative area, and the signal line shows that the bear trend is dominant under the Macd line.
If Bitcoin does not exceed the 50 -day SMA, the price may drop by $ 95,000 or less. On the contrary, over $ 100,000 may invalidate the current month’s trend and restart the bull momentum. Volatility is expected to increase in the Bitcoin market in the coming days and investors need to carefully monitor the technical indicators.