
Data from CryptoQuant shows that Bitcoin miners may not care about price and recent FUD above all else. Also, on-chain data indicates that Bitcoin MVRV is now approaching a crucial retest. Meanwhile, according to one analyst, the BTC price could continue to decline.
Bitcoin miners don’t sell!
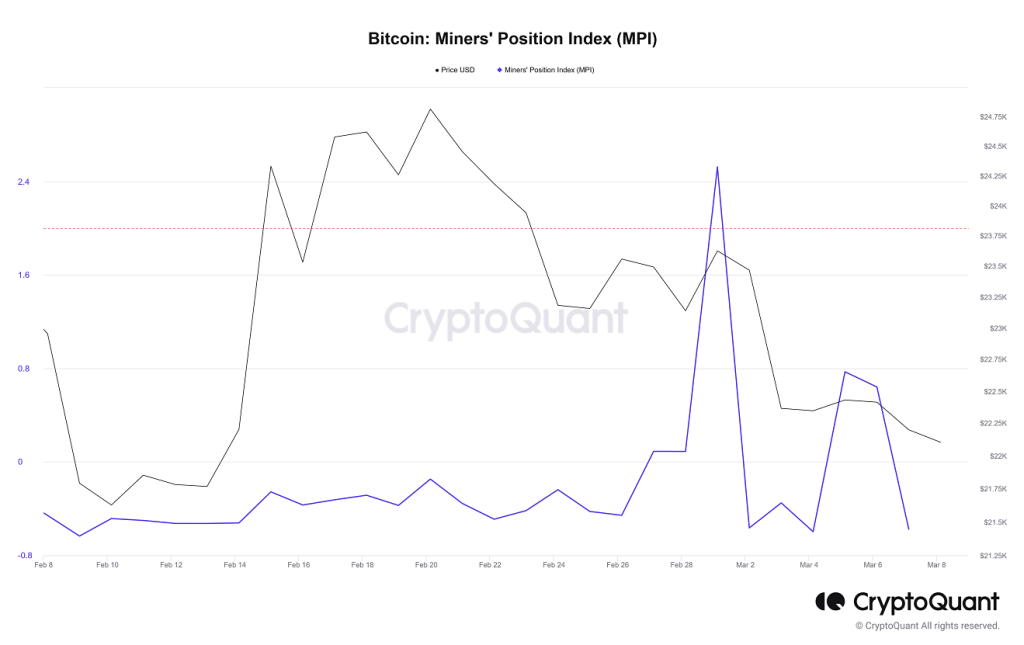
According to CryptoQuant’s Miners’ Position Index (MPI), a ratio between the total miner BTC outflows and the 365-day moving average of the same value, Bitcoin miners do not send their coins to external addresses, usually exchanges. On March 8, Bitcoin MPI fell to -0.57 from +2.52 on March 1.
 Bitcoin Miners’ Position Index (MPI) / CryptoQuant
Most of the time, the MPI fluctuates, rising and falling depending on the cryptocurrency exit. MPI increases when miners become aggressive by sending their cryptocurrencies to exchanges in bulk. As observed over time, this activity precedes a price drop, the effects of which resonate with the crypto scene. However, MPI has been on the decline in recent days. This likely means that miners are watching from the sidelines, holding their coins and not succumbing to the FUD spread by the bears recently.
Bitcoin MVRV rate approaches the 100-Day EMA line
As an analyst in a CryptoQuant post pointed out, BTC has previously continued to see long-term growth every time the metric has responded to this line. The “MVRV ratio” is an indicator that measures the ratio between Bitcoin market cap and realized value. The ‘realized cap’ here refers to a value model for BTC, which assumes that each coin in circulation has real value equal to the price at which it was actually last moved.
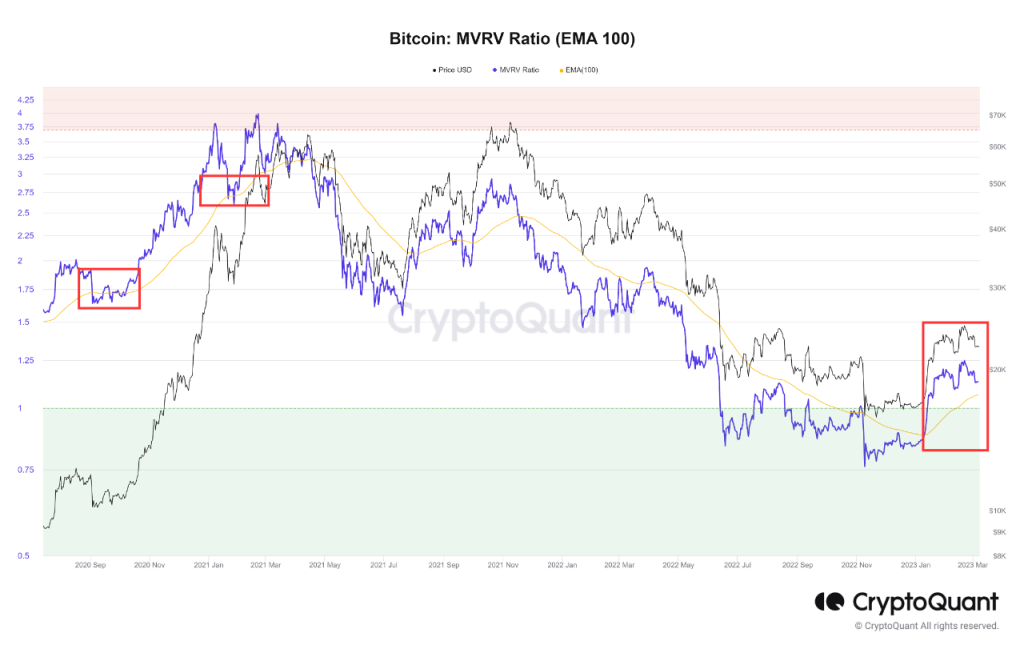
The realized cap is generally known as the fair value model for the asset. That’s why MVRV tells us whether the BTC price (market cap) is currently fair by comparing the two limits of the coin. A ratio greater than 1 means that the market cap is greater than the realized cap, so the cryptocurrency may be overvalued at this time. On the other hand, values below this threshold mean that the coin may be undervalued at the moment. Now, let’s look at a chart that shows the trend in the Bitcoin MVRV rate over the past few years and the 100-day exponential moving average (EMA).
 The value of the metric seems to be dropping in recent weeks / Source: CryptoQuant
As you can see in the chart above, the Bitcoin MVRV rate was below 1 at the lows of last year’s bear market, which indicates that the cryptocurrency is underpriced. But with the last rally, the metric broke out of this zone and now has a value greater than 1. In the chart, the analyst highlights the historical bottom zone in green and the upper zone in red. Currently, although MVRV is showing somewhat overvalued conditions, the price is still not high enough to hit the region where highs have occurred in the past.
An interesting pattern emerges when looking at the interaction of the indicator with the 100-day EMA curve. It seems that when the rate retested this line from above and bounced back successfully, Bitcoin price continued to enjoy some uptrend over the long term. Currently, as the rally comes to a halt and the price notices some decline, the MVRV rate is also declining and is currently approaching the 100-day EMA line. It’s also unclear whether the metric will continue this trajectory and retest. But if one continues and succeeds, if the past pattern is anything to go by, Bitcoin could feel some bullish pressure from it.
Most likely scenario for BTC: Continue the decline towards $20.3k!
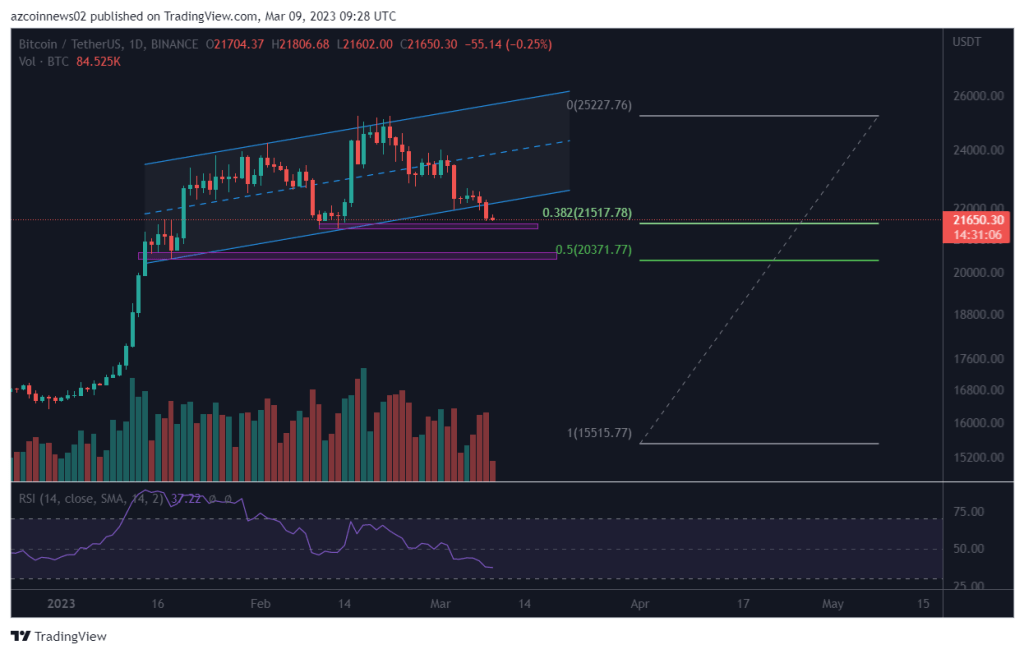
Crypto analyst David draws the technical picture of BTC as follows. cryptocoin.com After a strong increase since the beginning of the year, Bitcoin appears to be trading in an ascending parallel channel. This is a bearish pattern that usually leads to a failure in most cases.
Indeed, BTC price dropped below it on March 8 and is now approaching the $21.5k support area created by the horizontal support zone and the 0.382 Fib retracement level. While this zone has helped BTC bounce back before, breaking the ascending channel could trap bull investors who are buying as the price approaches the support line of the channel. Therefore, selling pressure may increase in the coming days. If so, BTC could decline below the $21.5K support area and decline to the next $20.3K support area formed by the horizontal support zone and the 0.5 Fib retracement level. The RSI indicator continues to drop and below 50 also supports this possibility.
 BTC weekly chart / Source: TradingView
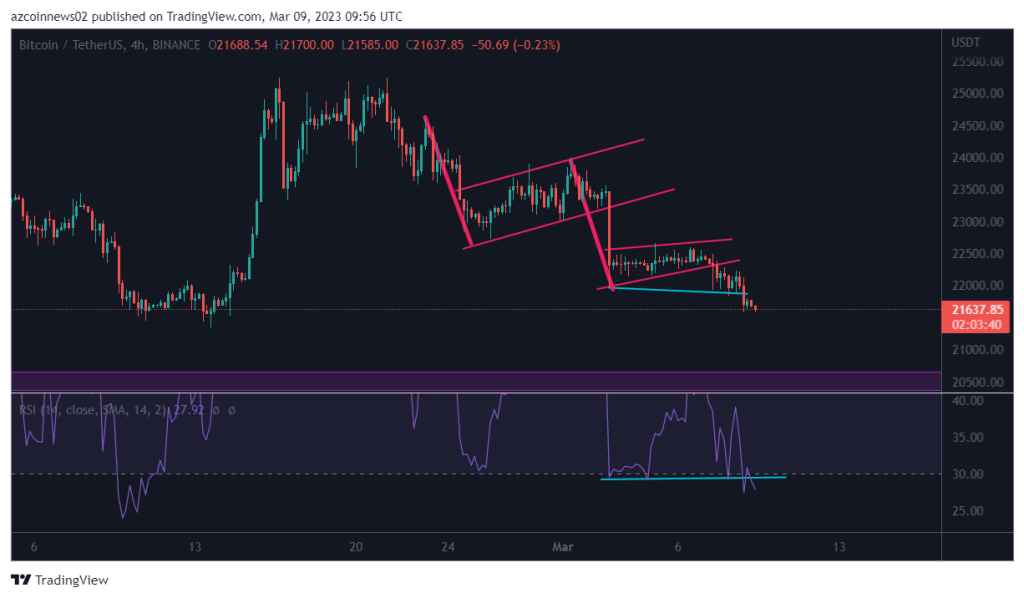
Technical analysis from the 4-hour chart supports the possibility of further declines as Bitcoin forms bear flag patterns with many large red candles pointing to strong selling pressure at higher levels. The RSI indicator also shows a bearish continuation as it is in the oversold zone and invalidating the previous bullish divergence (blue line). Therefore, BTC could dip below the $21.5K level and pull back to $20.3K before any significant relief rally takes place.
 BTC 4-hour chart / Source: TradingView
Overall, the most likely scenario is for BTC to continue falling to the $20.3K level. This bearish view will be invalidated if BTC rebounds from the current level and retraces the support line of the channel at $22.3K.