Bitcoin, the world’s largest cryptocurrency, has seen a notable rise in price in recent weeks, with the Net Unrealized Profit/Loss (NUPL) indicator rising above zero. This shows that investors are making a profit. Here are the details…
Significant metric break for Bitcoin
According to data from CryptoQuant, after a period of 21 months, NUPL is now breaking through. The NUPL indicator is used to determine whether Bitcoin holders are in profit or loss by calculating the difference between the current price and the price at which a particular coin was last moved. If the indicator is above zero, investors are in profit, if it is below zero, it means loss. When the 365-day and 60-day moving average lines are added to the chart, it is seen that the blue line has risen above the yellow line after a 21-month break.
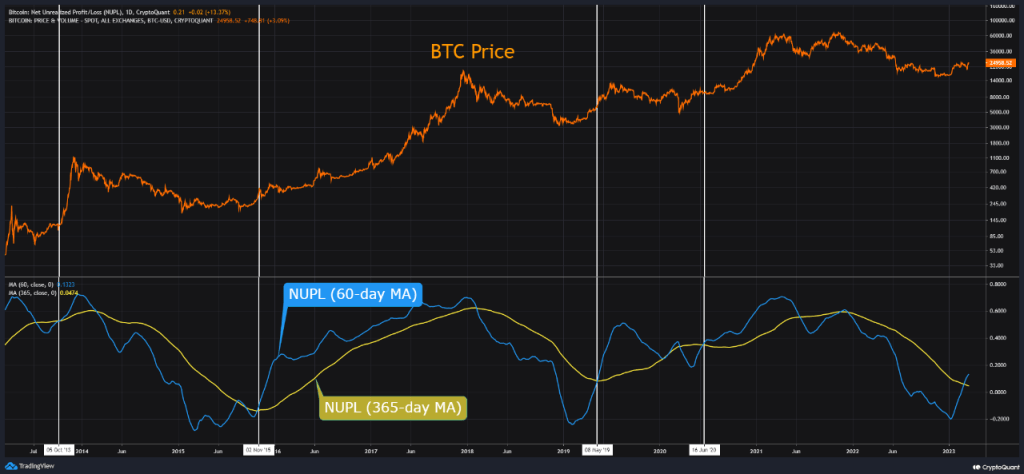
So, the last time the indicator broke was in June 2021, but then it continued to fall. This pattern has been repeated many times since 2013, and each time Bitcoin has experienced strong bullish rallies. However, it’s important to note that various on-chain and technical metrics indicate the bear market is over, but macroeconomic uncertainty can still cause disruption in any such scenario.
Many analysts believe this is the first major test for Bitcoin to prove its superiority as a store of value over traditional assets. Crypto’s performance in times of economic uncertainty is a crucial factor in determining its long-term success. Despite the recent rise in its price, Bitcoin remains a highly volatile asset. However, the NUPL boom seems to be a positive sign for Bitcoin investors.
Bitcoin has positive sentiment
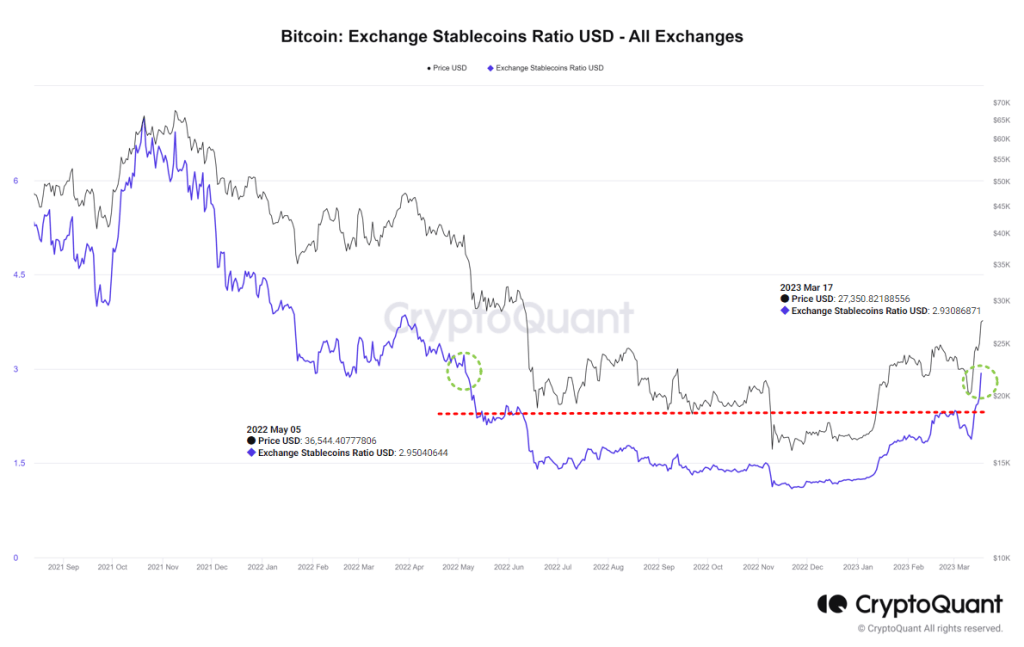
On the other hand, according to data from CryptoQuant, Bitcoin’s stablecoin ratio has returned to its May 2022 levels. To many, this is an important metric as it measures the potential purchasing power of Bitcoin. When the ratio value is low, it means that the ability to buy additional is high. The current indicator shows that the “Buy&Hold” portion has increased, which means that the current buying sentiment has improved significantly as opposed to the second half of 2022.
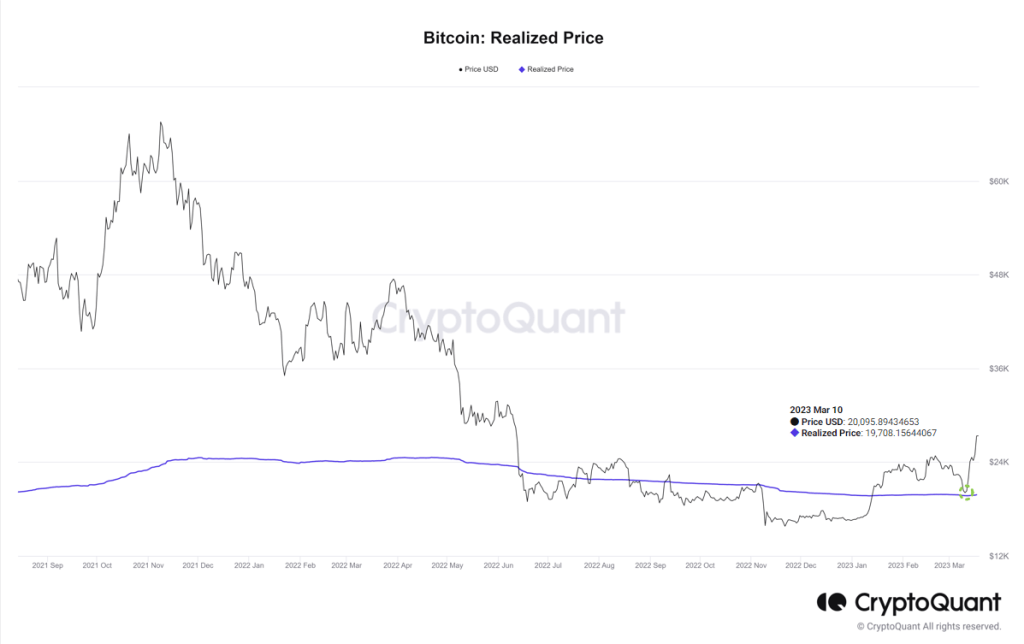
In addition, the data also reveals that the actual price of Bitcoin found a support line in its decline on March 10. This, cryptocoin.com As we have also reported, on March 10, when Bitcoin fell sharply due to problems in the banking sector, including Silvergate, it fell close to the realized price, but recovered. For many, this is a positive sign for investors holding Bitcoin for the long term.
What does the UTXO metric point to?
Another important metric provided by CryptoQuant was Bitcoin’s UTXO metric. This metric shows the average purchase price based on coin holding time. Recent data revealed that most of the new buyers profited last week. Specifically, the data shows that buyers holding Bitcoin 0 days to 1 day have an average purchase price of 26,556 USDT, while buyers holding Bitcoin 1 day to 1 week have an average purchase price of 23,808 USDT.
Overall, the new data released by CryptoQuant provides valuable insight into the current state of the Bitcoin market. While the cryptocurrency market is notoriously volatile, these metrics show positive sentiment among buyers and investors.