Bitcoin price slackened to the downside as traders await the $24.5k support to be maintained. While there is little change in the market, analysts are making critical predictions for Bitcoin.
BlackRock Bitcoin ETF plan revives markets
cryptocoin.com As you follow, Bitcoin bounced around $1,000 from the previous day’s lows. Popular trader Skew tracks price action around the major exchange Binance. Accordingly, it reveals compliant purchasing efforts at low levels. Sellers then approached $26,000.
$BTC Sellers found more coins https://t.co/wuHmiYVLrc pic.twitter.com/04bUfGHp3Q
— Skew Δ (@52kskew) June 15, 2023
This rise coincided with the news that the world’s largest asset manager BlackRock has applied to list a spot Bitcoin exchange-traded fund (ETF). According to Michaël van de Poppe, founder and CEO of trading firm Eight, this contrasts positively with the series of negative events related to crypto regulations over the past 10 days. “Blackrock’s ETF application is bullish for Bitcoin,” the analyst says.
It’s surprising that the major parties suddenly stepped in a week after all the SEC’s crackdown on crypto. They just want to rule the markets, it’s that simple. But overall, there are some positive signs for the markets.
BTC price may avoid $23,000 ‘staged’ price
When it comes to BTC on short timeframes, traders remain cautious due to more downside risks. Van de Poppe says lows around $24,500 should be held.
So far, so good #Bitcoin https://t.co/CP5l2dh2IB
— Michaël van de Poppe (@CryptoMichNL) June 16, 2023
At the same time, trader Crypto Tony points out that lows around $24,500 are maintained.
Spiked back up the support zone, so for me i am long scalping this up to $26,000 – $26,500. Only while we hold the lows put n yesterday pic.twitter.com/pd3bBHALRg
— Crypto Tony (@CryptoTony__) June 16, 2023
“In my view, nothing has changed,” continues Mustache, another analyst. Zooming in on the weekly chart, the analyst comments:
Fake exits are always possible. However, it is worth noting that BTC has returned to a falling wedge. This means retesting the Inverted Head and Shoulders Pattern as a Falling Wedge.
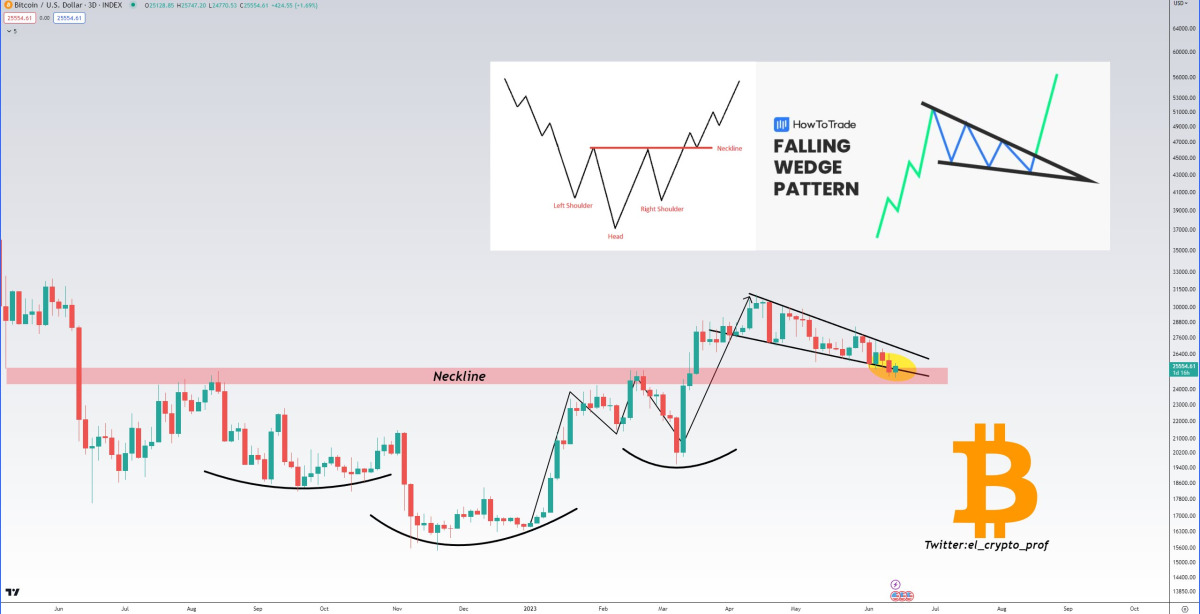 BTC explanatory chart / Source: Mustache
In this context, Mustache refers to the inverted head and shoulders model that emerged last year. Earlier this month, trader Mikybull Crypto suggested that a successful settlement would trigger a run up to $40,000.
BTC bears have short-term technical advantage
According to Kitco senior technical analyst Jim Wyckoff, Wednesday’s market-wide pullback resulted in July Bitcoin futures prices hitting a three-month low in early US trading on Thursday. “BTC bears generally have the short-term technical advantage,” Wyckoff said. It gained more strength late this week. The price downtrend is solidly featured on the daily bar chart. The path with the least resistance for prices is from the horizontal to the bottom.”
‘Hinge’ formation on Bitcoin price chart
Veteran trader Peter Brandt warns that the short-term outlook is showing signs of weakness. The analyst points to a “Hinge” formation on the BTC chart. In this context, “four closes within 3/10 of the 1% range. This is the definition of price equilibrium. ‘Hinge’ behavior,” he says.
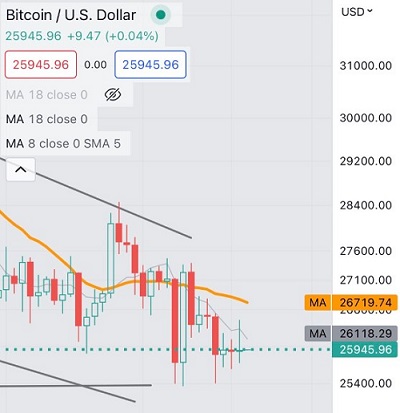 BTC 1-day chart / Source: Twitter
“Hinge” is a term traders use to describe the moment when a major trend reversal in BTC is about to happen. Brandt also shared another post on Thursday highlighting that the BTC price is “down for now.”
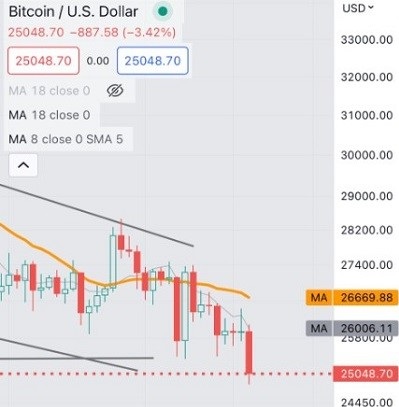 BTC 1-day chart / Source: Twitter
Bitcoin price follows an inverse head and shoulders pattern
Market analyst Caleb Franzen highlights several technical indicators that the Bitcoin price has fallen below. Accordingly, it provides additional information on the weakening bull case.
Short-term bull base is weakening as the price of #Bitcoin falls below the following key levels:
• The AVWAP from the Nov.'21 ATH's
• The short-term holder realized price
• The 200-week moving average cloudI'll still be DCA'ing
— Caleb Franzen (@CalebFranzen) June 14, 2023
Technical analyst Gert van Lagen also provides a macro perspective on where Bitcoin stands compared to previous cycles. Lagen states that Bitcoin is currently retesting the neckline of an inverse head and shoulders pattern.
$BTC's price action since 2013 ATH:
1. Bear market
2. Forms H&S Bottom, Head tests 200-week SMA
3. Breaks above neckline
4. Retests neckline for a few months
5. Breaks ATH
6. Blows offREPEAT
Currently at 4🚨#Bitcoin pic.twitter.com/hb4NKPQEQj
— Gert van Lagen (@GertvanLagen) June 15, 2023
At work Reasons for Bitcoin price rally!
BlackRock is believed to have a strong chance of getting the first spot-based Bitcoin ETF approved by the SEC due to its political influence and network. According to many experts, new capital inflows have the potential to be the catalyst for the next bull run. “For BlackRock to issue a BTC ETF would be the best thing that could happen to BTC,” said Mike Novogratz, CEO of Galaxy Digital. Accordingly, the news is likely to have created a bullish mood in the market.
In addition, Bitcoin hodlers continue to show historically high faith. On-chain Axel Adler Jr says total BTC inflows across all exchanges are currently at their lowest. He notes that this shows that Bitcoin holders are in no rush to sell their coins.
The total BTC inflow across all exchanges is currently at a low, indicating that Bitcoin owners are not in a rush to sell their coins. #Bitcoin #HODL pic.twitter.com/JTscheVcgO
— Axel 💎🙌 Adler Jr (@AxelAdlerJr) June 16, 2023
Bitcoin dominance is on its way to over 50%
Bitcoin dominance in the crypto market is approaching 50%. Experts think this could have significant implications for altcoins. If the historical, volatile trend between Bitcoin and altcoins continues, an increase in Bitcoin dominance will mean a bearish trend for the altcoin market. The analyst, nicknamed Evca Wolf, says there is an opportunity for emerging trend traders to choose the right altcoins for the next bull market.
#Bitcoin dominance is entering the resistance zone at 50%.
If #BTC break it, we will see more blood baths on #altcoins ⚠️
It will be your chance to choose the right ones for the next #bullmarket 🚀 pic.twitter.com/e25IK8qUjx
— Evca Wolf (@evcawolfCZ) June 14, 2023
Bitcoin price and stock market repeat history
Bitcoin price has been following a downtrend for weeks as the stock markets are enjoying growth. Earlier this year, the situation was reversed when US banking failure threw the S&P 500 Index down. Meanwhile, BTC performed well. Since then, the stock market has evolved to correlate negatively with the crypto market and Bitcoin. Also, the correlation fell to the lowest point since December 2022.
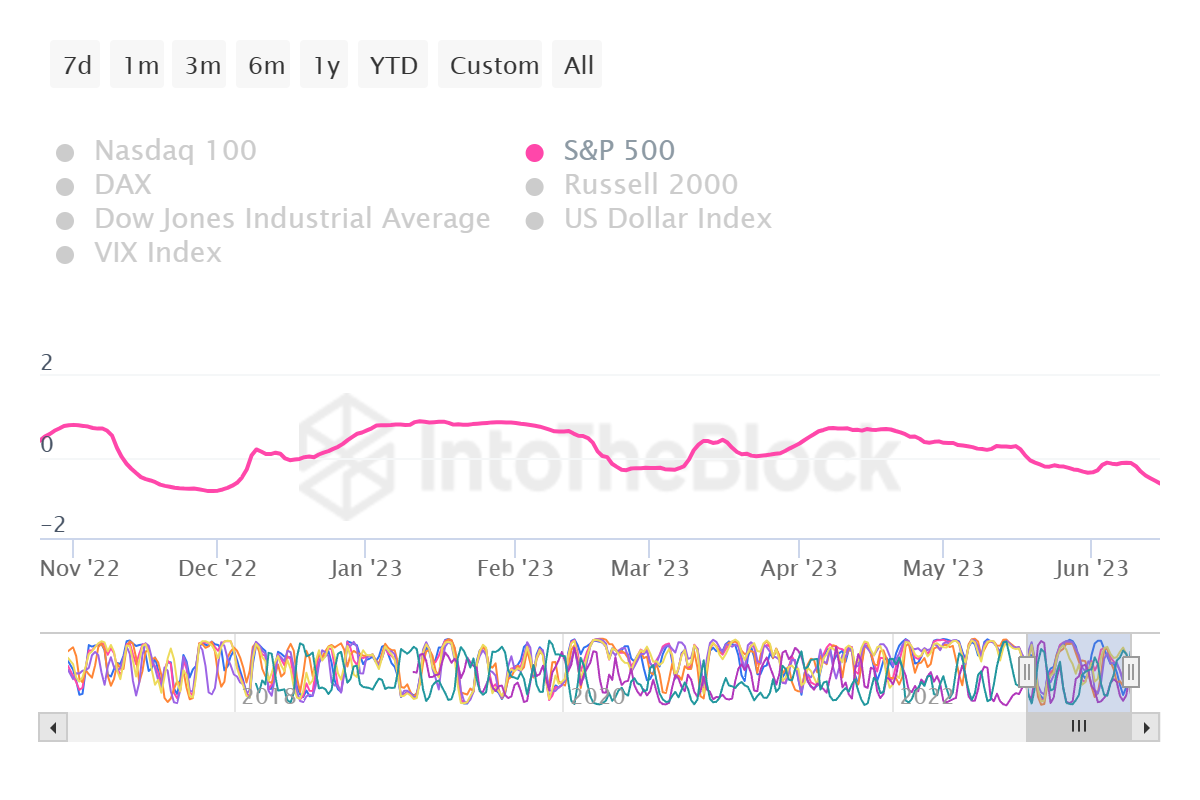 Correlation between Bitcoin price and stock market
The traditional market is still doing well after allaying fears of “sell in May”. In this environment, Bitcoin price dropped below $25,000, marking a three-month low. The negative correlation of 0.55 will remain valid until the momentum of one of the two assets changes.
As analyst Dan Gambardello noted, such was the case in 2019 when the Bitcoin price fell by about 34% while the stock market was rising. However, the cryptocurrency market has started a recovery attempt. This refuted the claims that the crypto market “was in the dust of the stock market”.
HEARTBREAKING: The stock market has completely left crypto in its dust! It must be completely over…
Or is it?
Look at #Bitcoin in 2019 falling -34% while #SP500 rallied.
Go with the data…not emotion. pic.twitter.com/kmyu7bvYUr
— Dan Gambardello (@cryptorecruitr) June 15, 2023