bitcoinThe rainbow chart, an analysis that has been working since the day it came out, predicts that Bitcoin will reach a six-digit price within 2 years.
The rainbow chart adapted to Bitcoin continues to work steadily to this day. The latest analysis on the rainbow chart predicts that the price of Bitcoin (BTC) will reach a six-digit level in the next two years.
Bitcoin (BTC) Price Prediction
Bitcoin (BTC), which is called the flagship of cryptocurrencies, continues its price action in the $ 20 thousand band. However, traders follow the charts and signals as they are curious about the next levels.
One of the tools used to determine possible Bitcoin price action is Bitcoincenter’s rainbow chart. The chart evaluates historical Bitcoin price data, offering perspective on how it could potentially move in the future.
In the long run, if the chart moves within expectations, it is expected to come to the dark red region. This shows that by October 9, 2024, Bitcoin will reach $ 626,383.
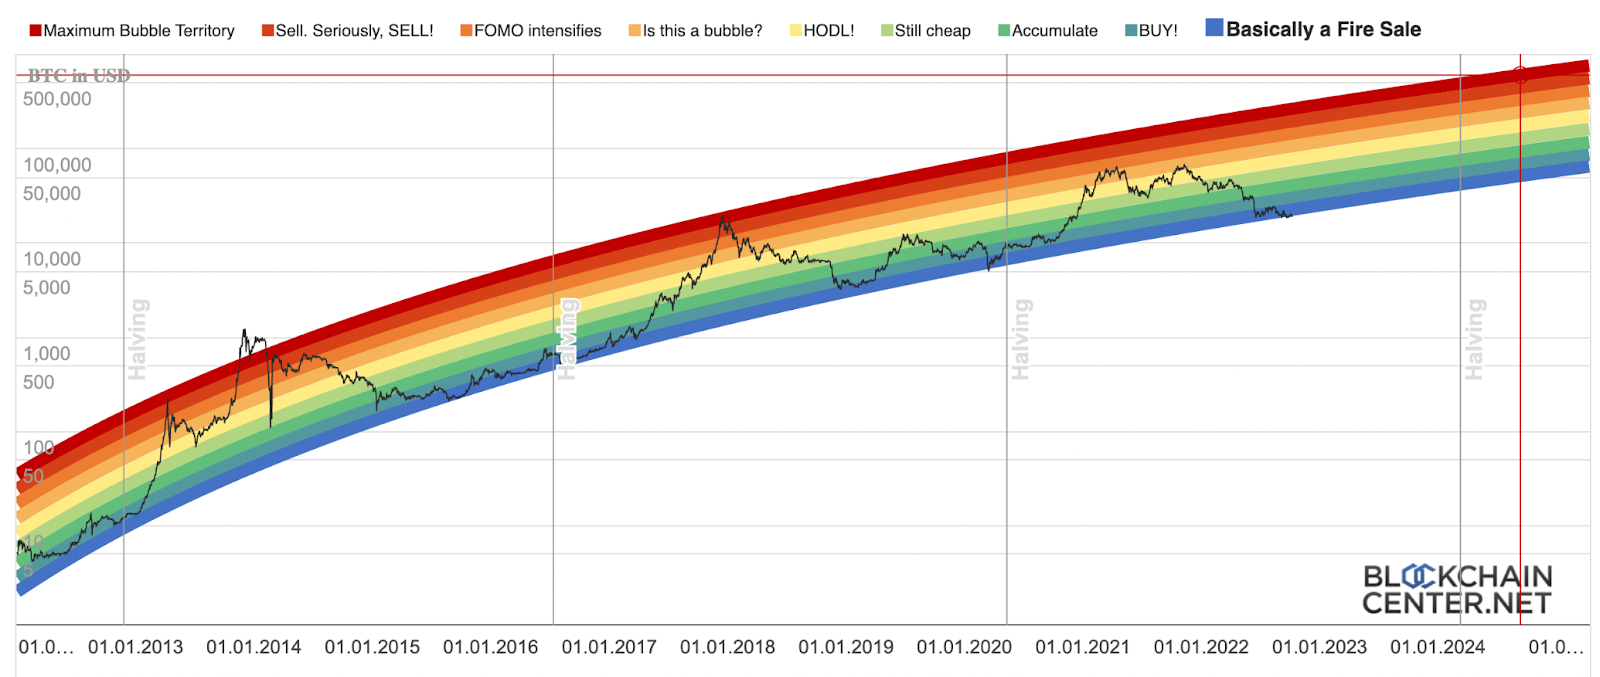 Bitcoin’s rainbow chart Source: Blockchaincenter.net
At the same time, the chart shows that the bottom of the current cryptocurrency bear period may have come. In particular, the price of Bitcoin, which is around $ 19,500, is evaluated in the region represented in blue.
At the beginning of the uptrend, the rainbow chart also shows that Bitcoin HODL will start towards the end of the year when the price hits the $86,151 band according to the forecast data.