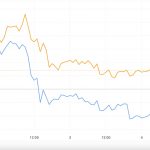
While Bitcoin continued its positive trend upwards, it also shed light on its target target of 31 thousand dollars. It was noted that investors are hopeful about BTC, which is expected to see a double bottom formation, albeit in the short term.
We have compiled price analysis and predictions for popular crypto currencies BTC, XRP, ETH, SOL, MATIC for you…
Bitcoin (BTC) price analysis
The upward 20-day exponential moving average ($26,903) and the relative strength index (RSI) in the positive zone show that the bulls have the upper hand. In the coming period, investors will once again try to overcome the general resistance at $28,143.
A close above this level would complete a short-term double bottom formation with a target target of $31,486.
This positive prediction will be invalidated if the price turns down from overhead resistance once again and falls below the 20-day EMA. This may push the price to 26 thousand dollars. The BTC/USDT pair may then continue to consolidate between $24,800 and $28,143 for a while.
Ripple (XRP) price analysis
Buyers pushed XRP above the symmetrical triangle formation at $0.54 on September 29, and subsequent attempts for the price to pull back into the triangle were thwarted.
From now on, the general resistance at the $ 0.56 level will be tried to be overcome. If successful, this will signal the beginning of a new uptrend. The XRP/USDT pair can then start its journey towards the formation at $0.66.
Conversely, if the price turns down from $0.56 and breaks below the uptrend line, this could keep the pair between $0.56 and $0.41 for a few more days.
Ethereum (ETH) price analysis
The 20-day EMA ($1,640) is flattening out and the RSI is near the midpoint, indicating a balance between supply and demand. If the price turns up from the current level, the bulls will again try to overcome the $1,746 hurdle. If they can achieve this, the ETH/USDT pair will complete the double bottom formation and have a target of $1,961.
On the other hand, if the price continues to decline and breaks below the moving averages, it will indicate that the pair may extend its stay in the range of $1,531 to $1,746 for some more time.
Solana (SOL) price analysis
Solana fluctuates in a wide range between $14 and $27.12. Price movements over the last few days have led to the formation of a potential inverse head and shoulders formation.
If the price rises and breaks above the neckline, the SOL/USDT pair may attempt a rise towards $27.12 and eventually the formation target of $32.81.
The critical support to watch on the downside is the 20-day EMA ($20.95). If the price falls below this level, it will indicate that the bulls have given up. This could open the doors for a possible decline to $17.33.
Polygon (MATIC) price analysis
MATIC price is struggling to climb above the $0.60 overhead resistance. If it achieves this, it will mark the beginning of a sustained recovery. The MATIC/USDT pair may then rise to $0.70.
Contrary to this assumption, if the price turns down and breaks below the 20-day EMA, it will indicate that the bears are active at higher levels. The pair could then retest the important support at $0.49.


