
The Current State of Bitcoin: A Bull Run or Something More Challenging?
Since the beginning of 2023, Bitcoin (BTC) has embarked on a classic stairstep bull run, marked by gradual price increases followed by consolidation periods that prime the market for subsequent upward movements. Currently, the cryptocurrency is consolidating its price in the range of $90,000 to $100,000, representing the third phase of a broader bull run that began from a low of $20,000. Many analysts anticipate that this consolidation will ultimately culminate in a significant bullish breakout, mirroring similar patterns observed in mid-2024 and throughout 2023.
However, three key developments suggest that the outlook may not be as optimistic as it appears.
Tightening USD Liquidity
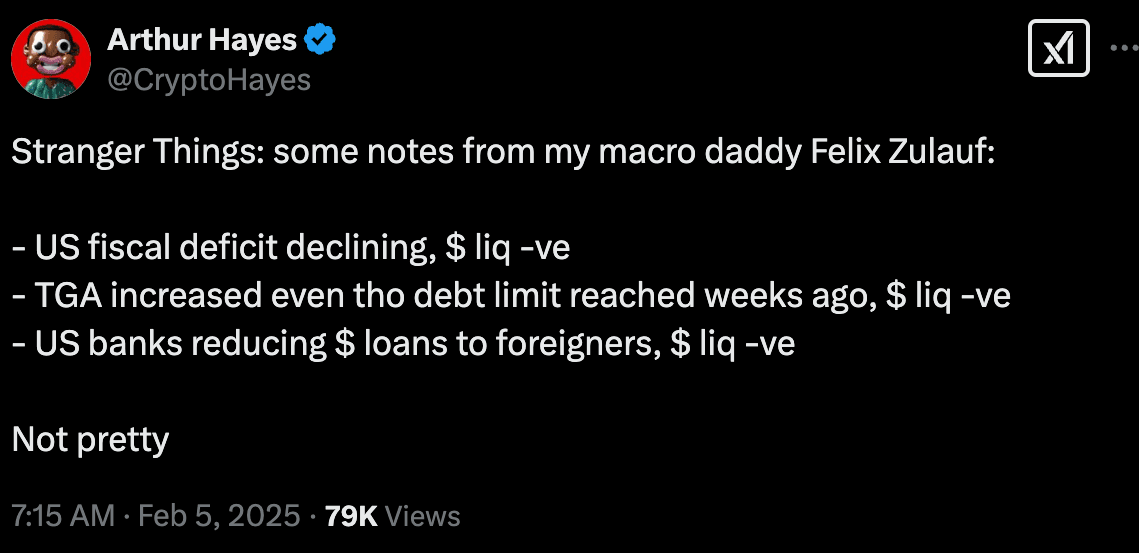
One fundamental principle that applies to all asset classes, including cryptocurrencies, is that they generally do not respond well to tightening fiat liquidity, especially from the U.S. Dollar (USD), which serves as the global reserve currency. Unfortunately for BTC proponents, recent trends indicate a tightening of dollar liquidity driven by several factors. Arthur Hayes, the Chief Investment Officer at Maelstrom, highlighted this on social media platform X.
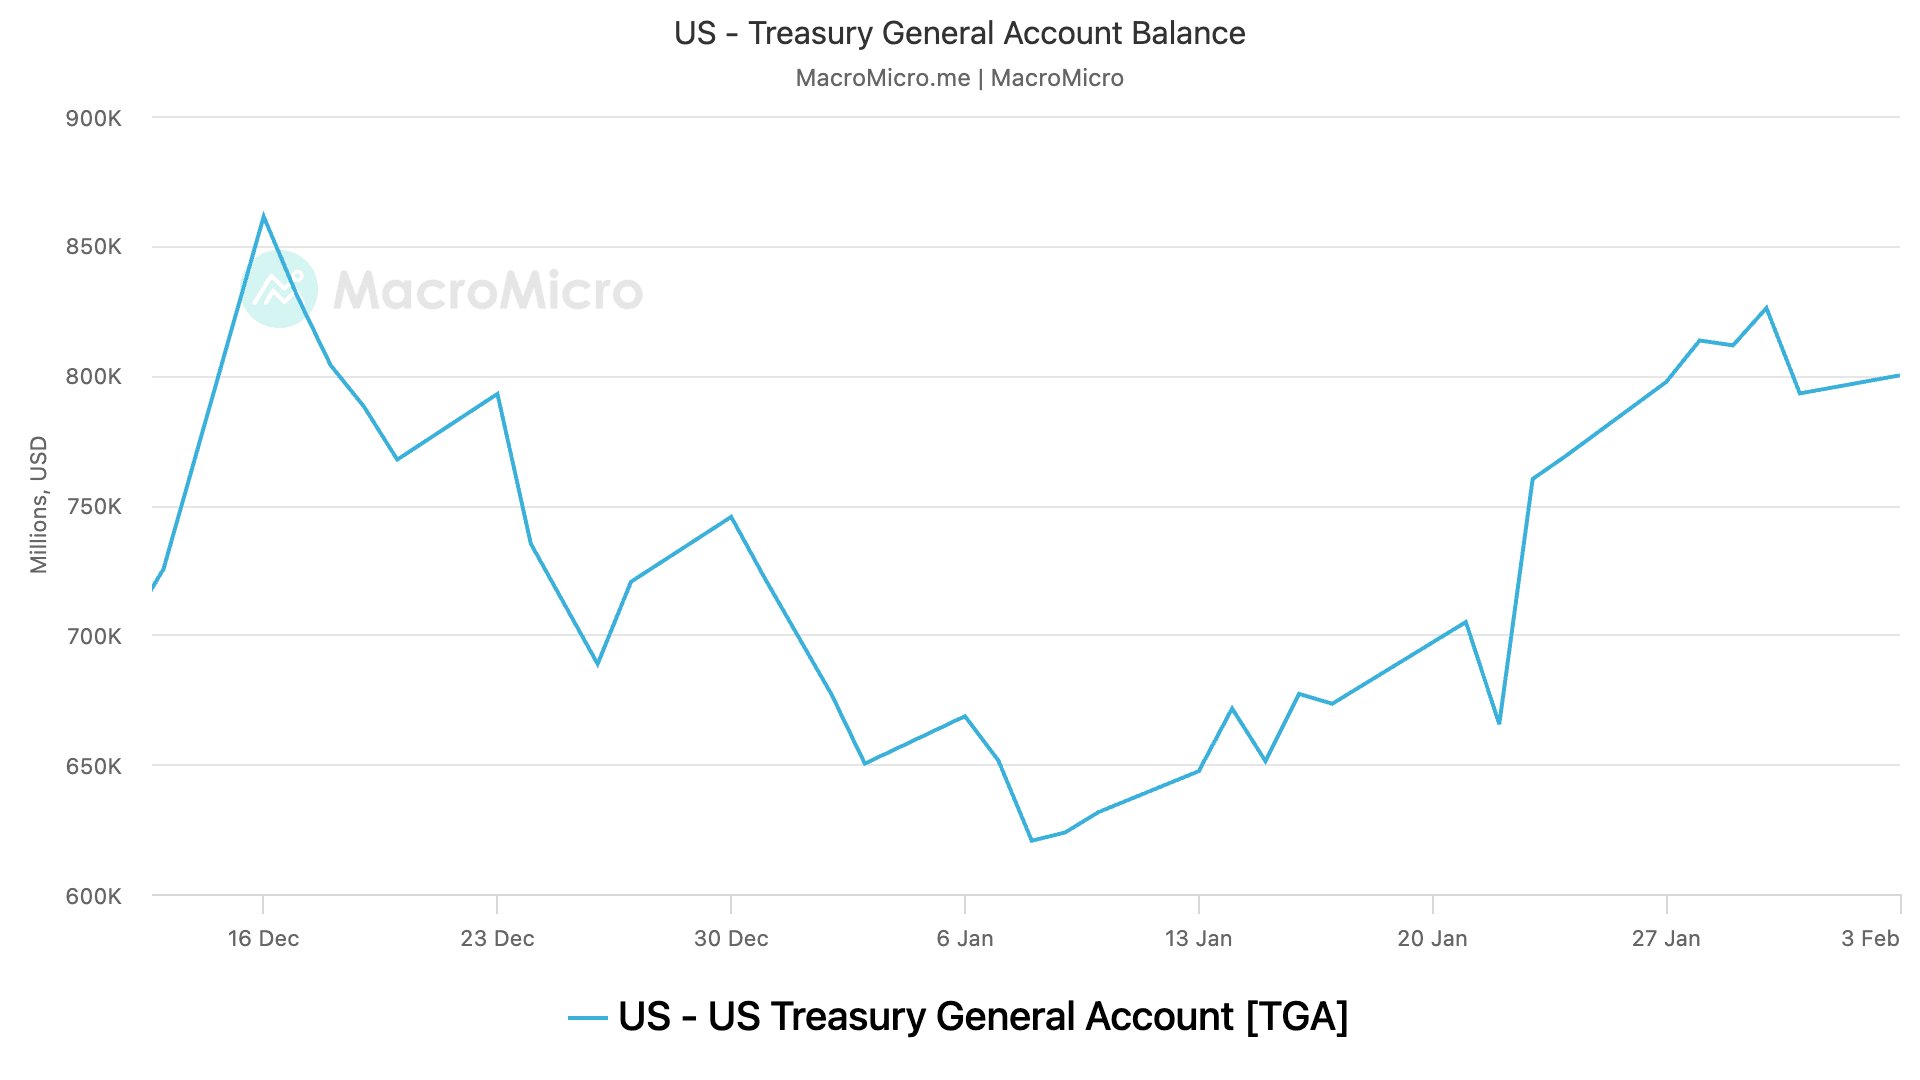
According to data from MacroMicro, the USD cash balance in the Treasury General Account (TGA)—the U.S. government’s checking account at the Federal Reserve—has surged from $623 billion to $800 billion within a mere four weeks. Following the U.S. reaching its self-imposed debt ceiling of $36 trillion last month, there was hope among market participants that the Treasury would reduce the TGA balance as part of its extraordinary measures to keep the government operational. Such actions would inadvertently inject liquidity into the economy and financial markets, similar to what occurred during the previous debt ceiling crisis in early 2023, which had bolstered risk-taking in both equity and crypto markets.
Anddy Lian, a thought leader in blockchain and an expert in intergovernmental affairs, stated, “We are witnessing a scenario where key liquidity sources are becoming scarce or are being controlled more tightly. This could potentially lead to slower economic activity, increased borrowing costs, and a more challenging landscape for risk assets, including cryptocurrencies.”
Trump Administration’s Caution on Strategic BTC Reserve
Since taking office on January 20, President Donald Trump has actively pursued various campaign promises related to tariffs, immigration, and international relations. However, one area where he has shown notable caution is regarding the establishment of a strategic Bitcoin reserve. This initiative previously acted as a significant catalyst for BTC’s price surge from $70,000 to over $100,000.
Recently, the Trump administration has opted to “evaluate” the feasibility of creating such a reserve, marking a disappointing shift for cryptocurrency investors who had anticipated swift action akin to Trump’s rapid responses on other matters. Jim Bianco, president and macro strategist at Bianco Research, LLC, commented, “Wait, Trump said he would do a $BTC Reserve, not just promise to ‘evaluate it.’ The word ‘evaluate’ or ‘study’ is what Washington does when they wish to avoid taking action.”
Following this news, BTC experienced a decline, dropping from over $100,000 to $96,000 in overnight trading after Trump’s crypto Czar disclosed to CNBC that evaluating the feasibility of a Bitcoin reserve is a primary focus of the new task force.
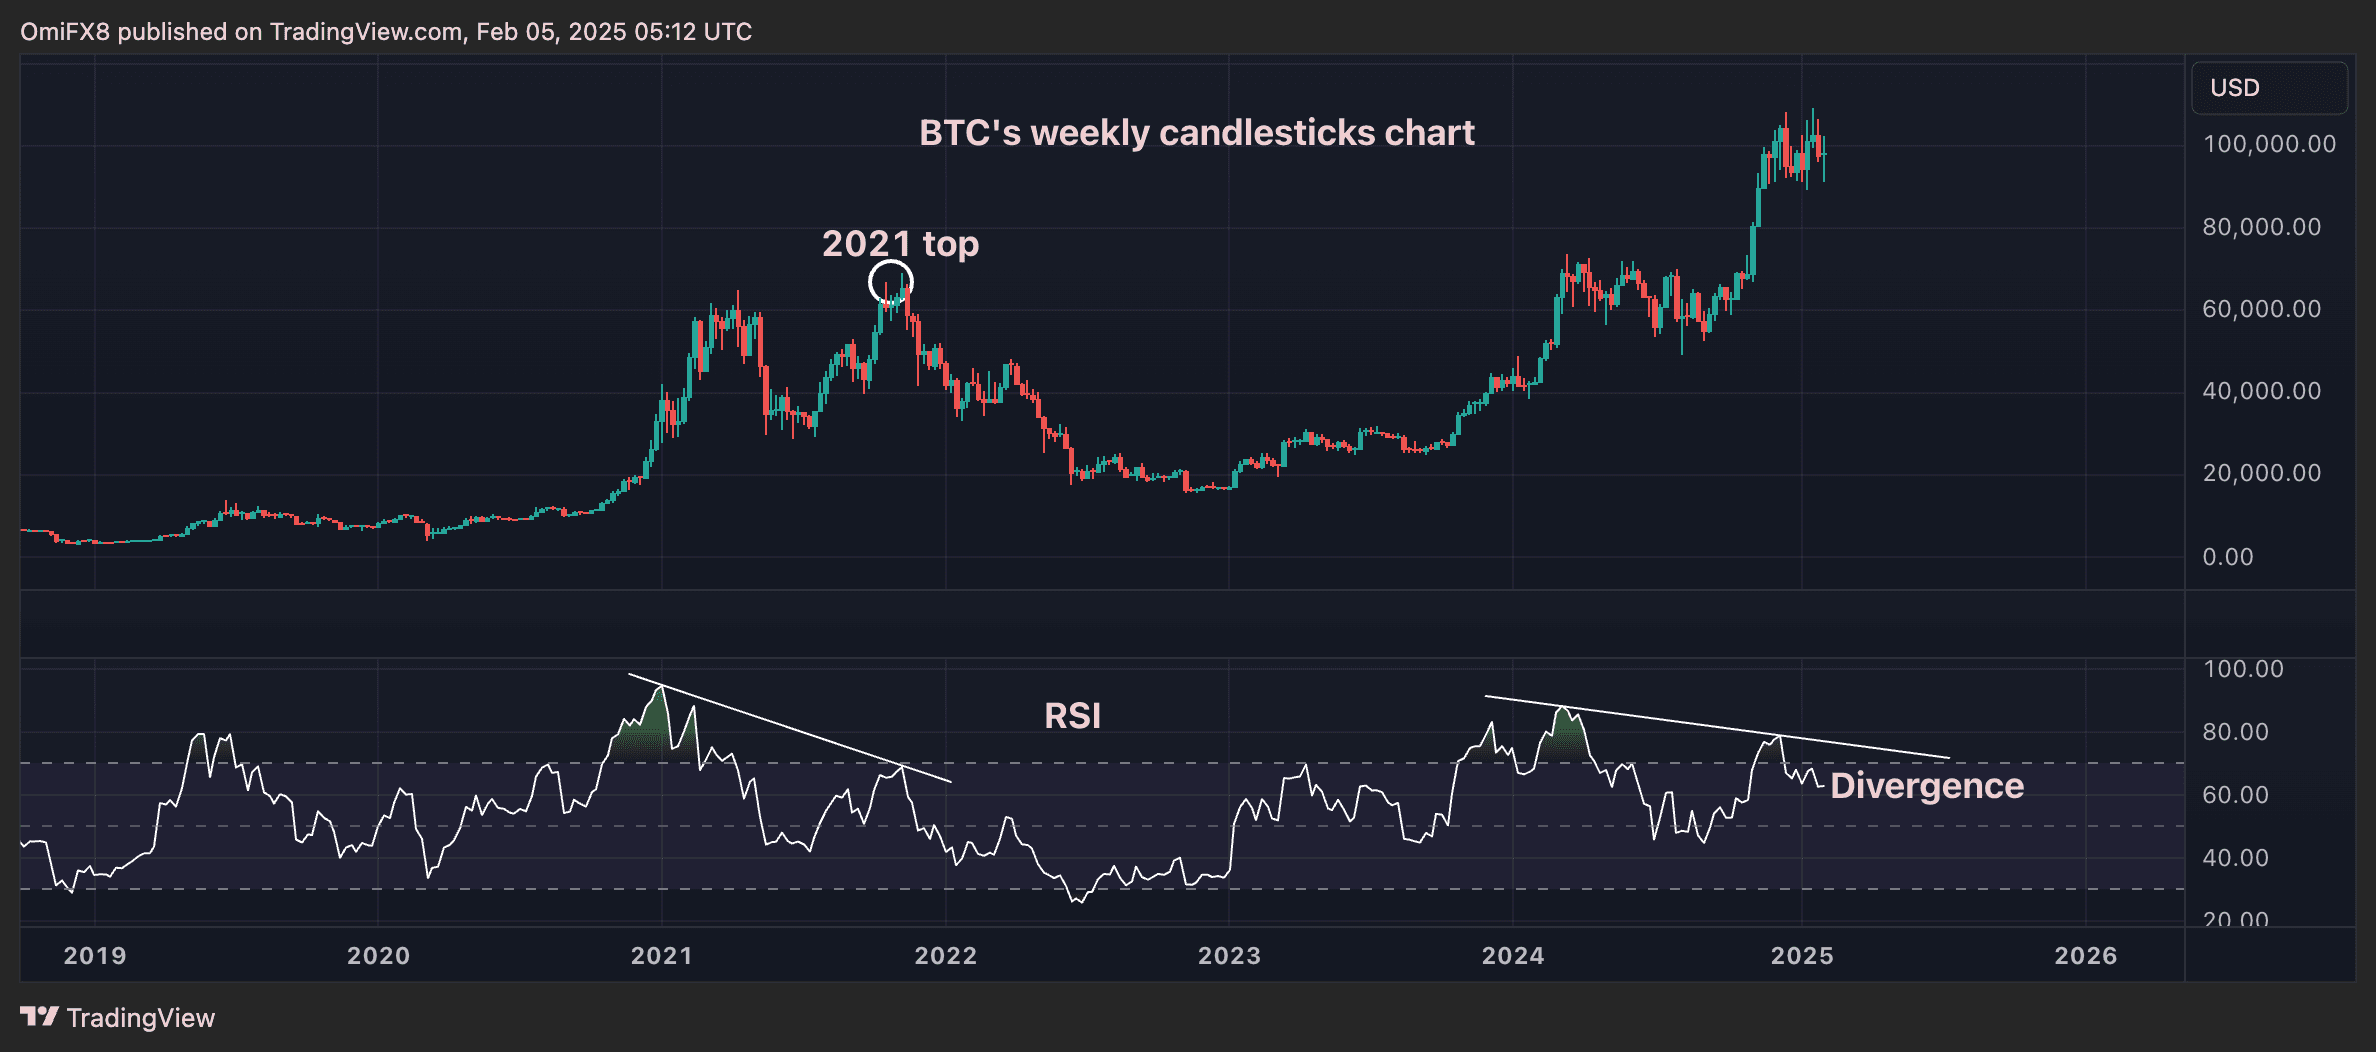
The Reappearance of a 2021 Topping Pattern
For those looking to technical charts to determine Bitcoin’s next move, it might be wise to examine the 14-week relative strength index (RSI). Recently, the oscillator has shown a bearish divergence reminiscent of the pattern seen at the 2021 market peak. A bearish RSI divergence occurs when the price makes higher highs while the RSI produces lower highs, signaling a potential slowdown in bullish momentum.
The weekly candlestick chart for BTC, viewed alongside the RSI, reveals this concerning trend. The RSI has created a lower high compared to its December peak, diverging negatively from the ongoing price uptrend, which echoes the behavior observed in 2021.
This negative technical setup could be invalidated if the RSI crosses above the falling trendline indicative of the divergence, which would signal a resurgence of bullish momentum.