A famous analyst has published an updated spiral chart of Bitcoin (BTC) cycles. According to him, the cryptocurrency market is currently in an early stage of the bull market. Each phase of the four-year cycle is accompanied by recurring psychological states of investors.
Every Bitcoin cycle has 3 phases
Renowned analyst Theratinalroot shared an updated version of the Bitcoin spiral chart yesterday. He briefly describes the rather complex fractal structure, “The 4-year cycle is a hit! Each cycle consists of 3 phases.” defined as. The idea behind this innovative graphical representation of BTC’s historical price is the Bitcoin cycles hypothesis. This narrative is well known in the cryptocurrency market. It is also based on a halving event that occurs approximately every 4 years.
But according to the analyst, each of BTC’s three historical cycles to date has occurred in 3 recurring phases. Interestingly, the analyst does not take into account the initial formation cycle. Because “Bitcoin’s first year price data is not that interesting as it is a bit outlier because there is no price data,” he says. Therefore, the 3 phases of every 4-year Bitcoin cycle are as follows.

Mature bull market lasting about 1 year
It historically starts with BTC halving. On the chart this is the first quarter (upper right). This phase ends with a new Bitcoin all-time high (ATH). It also highlights that sometimes there can be double peaks (as in 2013 and 2021) and sometimes a single peak (as in 2017 and potentially 2025).
Y last about 1 year biggest bear market
It follows the euphoria and the “explosive peak” of the BTC price. This is the second quarter of the chart. On average, at this stage of the cycle Bitcoin loses 80% of its value. Also, the entire downtrend ends with 2 or 3 capitulation events. The vast majority of investors lose hope here.
Early bull market lasting about 2 years
This is the left half of the graph. After sharp dips and reaching a macro price bottom, there is a long accumulation phase and a slow rise in BTC price. During this period, Bitcoin generally rises. However, it does this very slowly with numerous fixes.
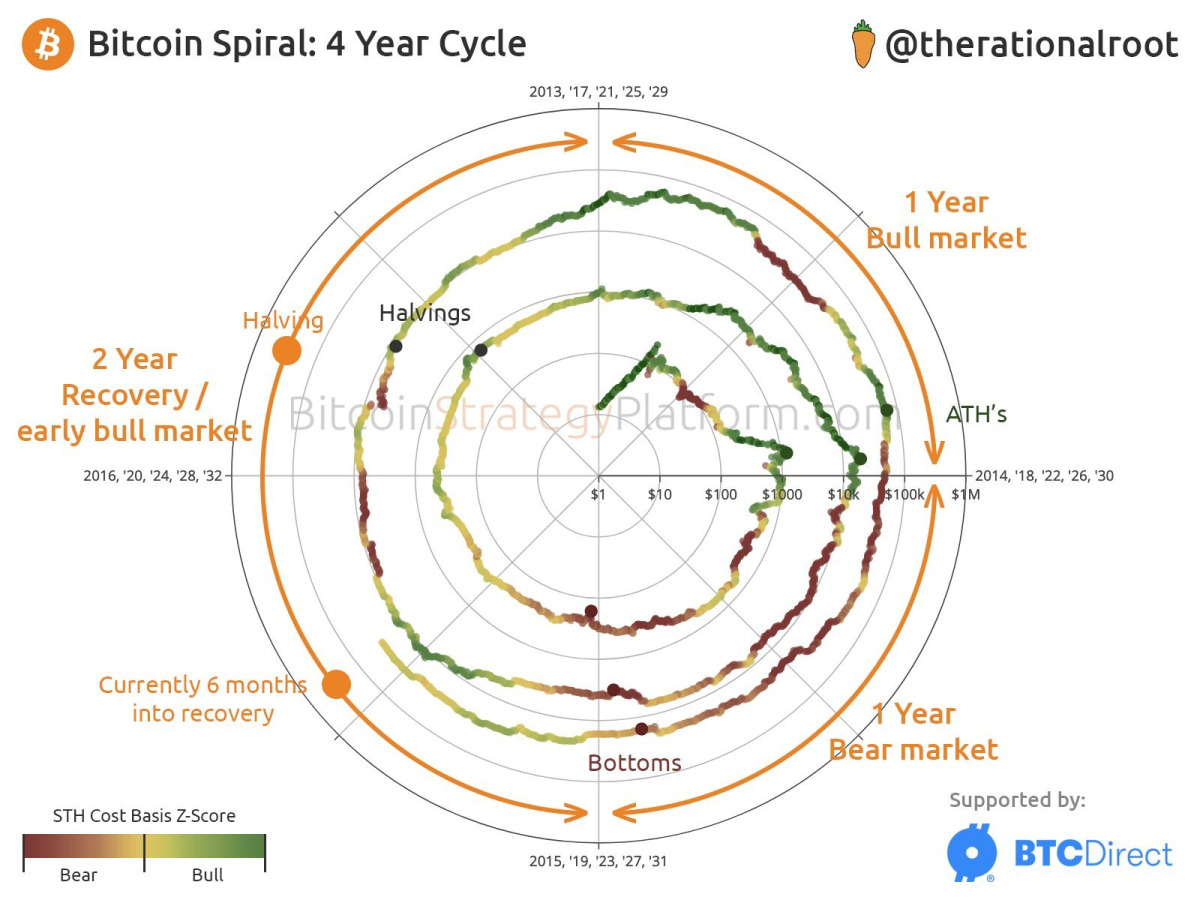 Bitcoin 4-year spiral cycles / Source: Twitter
BTC’s spiral fractals
According to the analyst, Bitcoin is currently in the third phase of its cycle. This has been going on since roughly the beginning of 2023. At least until the next halving. cryptocoin.com As you follow, the latest data from BuyBitcoinWorldwide shows that the halving will take place on April 17, 2024. An interesting illustration of the above chart highlights the fractal similarities between Bitcoin cycles. These are not only related to the timing and regularity of the recurring phases, but also to the profits and psychology of crypto market investors.
First of all, the analyst colors the chart on a scale from intense green to strong red. The first of them shows the maximum profits of the market participants, the second shows the maximum losses. The data is based on the on-chain STH Cost Base Z-Score indicator, which roughly describes the state of market participants’ short-term investments. Their behavior best reflects the repeating patterns of BTC price action. The analyst later also posted a slightly different version of his chart. Here he assigns the successive stages of Bitcoin’s 4-year cycle to the stages of investor psychology. These express the dominant emotions surrounding market participants at each stage of the cycle.
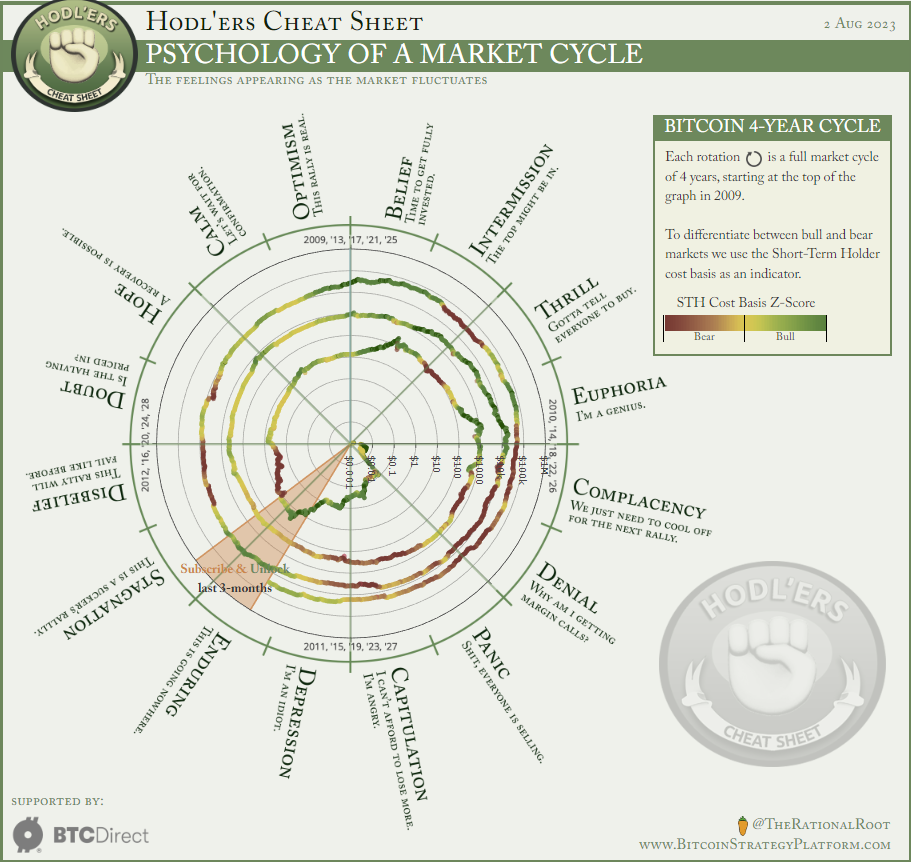 Cryptocurrency market psychology / Source: bitcoinstrategyplatform.com
The psychology of market participants should not be forgotten!
Thus, we see that the fractal similarity between Bitcoin cycles does not only arise in terms of the price of the leading crypto. It is also about the psychology of market participants. Spiral cycles capture the prevailing sentiment that overwhelms investors, as they describe halving-related changes in BTC price.
Naturally, the juxtaposition of price movements and investor psychology is not self-explanatory. After all, that’s how it’s worked in traditional financial markets for decades. Also, the psychological phases featured in BTC’s spiral chart overlap with those highlighted in the classic Wall Street Cheat Sheet: Market Cycle Psychology. However, the main difference is in mature traditional asset markets. Loops are much more difficult to detect. It is also worth noting that it usually takes much longer than 4 years.
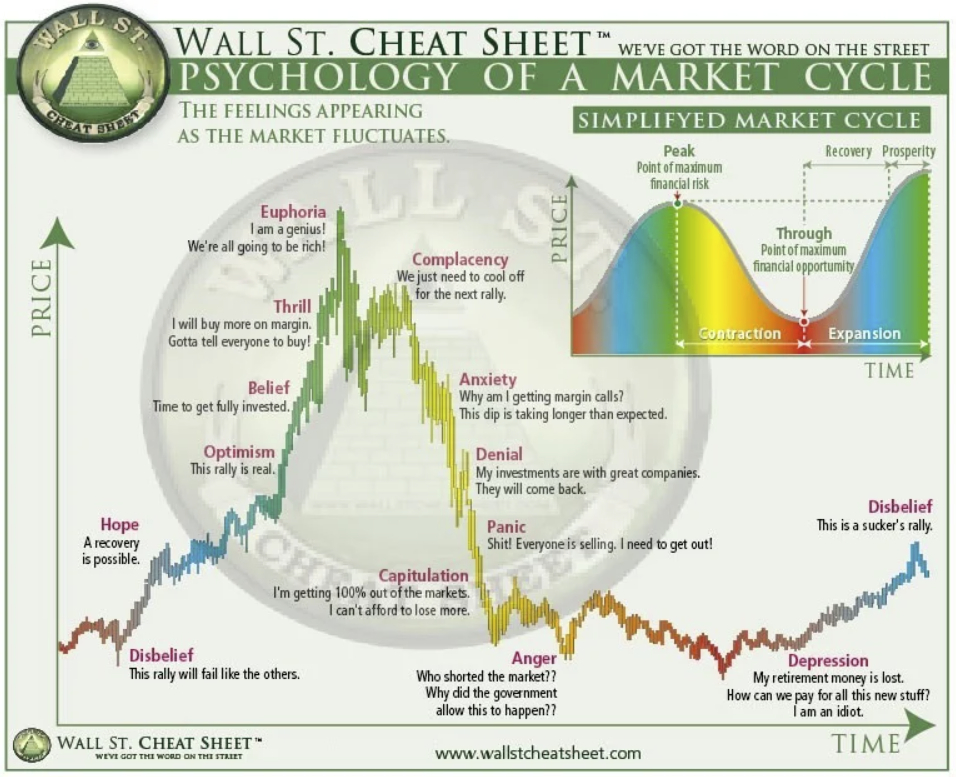 Wall Street Cheat Sheet: The Psychology of the Market Cycle / Source: financialhorse.com
Bitcoin price prediction: $60,000 by the end of 2024
The analyst ends his discussion with a Bitcoin price prediction by the end of 2024. According to him, BTC price is likely to return to the $69,000 ATH zone in the next 1.5 years. He points out that the first phase of the bull market so far has resulted in a recovery of about 30% of the loss (from $15,000 to $30,000) against ATH. In contrast, the remaining 70% must be compensated by the end of 2024. At the same time, he predicts that in April 2024, the BTC price will halve and fluctuate around $40,000. It also predicts that it will hover in the $50,000 – $60,000 range in the second half of 2024.
Despite these moderately bullish BTC price predictions, the analyst advises caution. It is reminiscent of events that have the potential to cause deviations from the usual rhythm of Bitcoin cycles. According to him, early confirmation of BlackRock spot Bitcoin EFT could accelerate the bullish phase. On the other hand, it refers to the still lingering fears of a global recession. If a recession occurs, it will definitely affect the cycle of Bitcoin and the entire cryptocurrency market. However, its consequences will be difficult to predict.