
Last week, the Bitcoin price experienced another drop on September 6, dropping below $19,000. The cryptocurrency, which subsequently recovered, is currently hovering above $ 21,500. Meanwhile, Fed Chairman Powell reiterated his aim to end inflation as quickly as possible. He pointed to the interest rate. Basically, increases in interest rates and quantitative tightening ultimately lead to a reduction in the cost of goods and services. However, according to experts, we are not at that point yet. In the current situation, it is expected that the interest rate increase will decrease the shares. This, in turn, negatively affects BTC, which is associated with stocks. So, from a technical point of view, what are the charts and analysts saying?
Bitcoin investor tool: 2-year MA multiplier
Bitcoin’s price is currently down by 70% from its all-time high of $69,000. In the previous bear markets, the price of BTC saw a 55% correction (July 21). It also saw a 71% decline by March 2020 and an 84% correction in December 2018. While hard to bear, the current 72% correction seems not out of the norm. According to analyst “Big Smokey”, when we compare this bearish data with the 2-year MA multiplier, you can see that the price has dropped below the 2-year moving average. You will notice that this creates a trough and then consolidates for several months before continuing the 12-year uptrend.
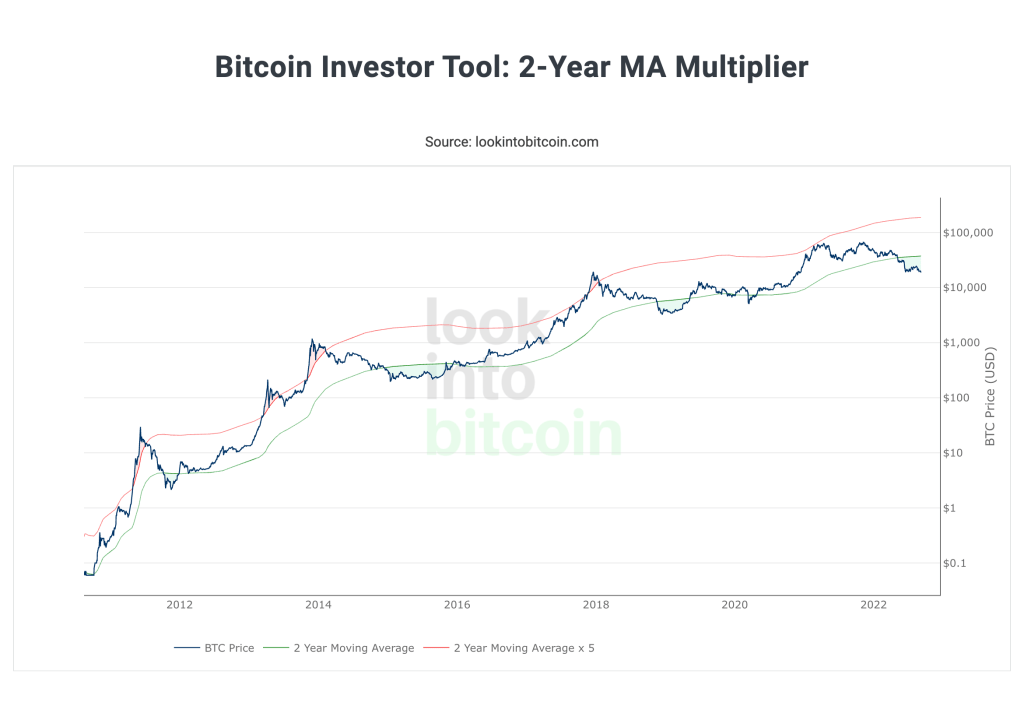
These areas are the “shady” areas below the green 2-year moving average. When we zoom in on the right side of the chart, we can see that the price is again below the 2-year moving average. There is no indication that a “pit” has been dug. However, if historical data is to be trusted, we may see the price go higher. According to the expert, BTC is currently in a region that can be described as a consolidation zone.
BTC and the “golden ratio multiplier”
Another interesting moving average and Fibonacci sequence-based indicator that shows Bitcoin’s price undervalued is the golden ratio multiplier. cryptocoin.comAs we reported, Philip Swift, creator of LookIntoBitcoin, has the following statements about this tool:
The chart explores Bitcoin’s adoption curve and market cycles to understand how the price may behave over medium to long-term timeframes. To do this, it uses multiples of the 350-day moving average (350 DMA) of Bitcoin price to identify areas of potential resistance to price movements. Certain crosses of 350DMA have been very influential over time in selecting intra-cycle highs for Bitcoin price as well as major market cycle highs. It’s an effective tool because it can show when the market is overstretched in the context of Bitcoin’s adoption curve growth and market cycles.
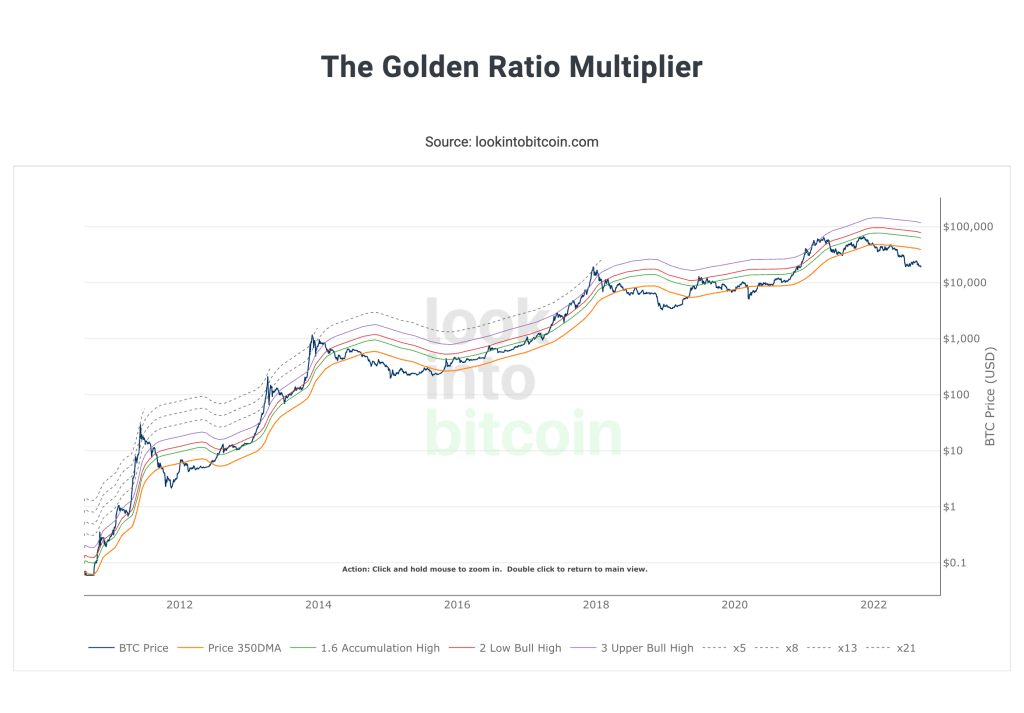
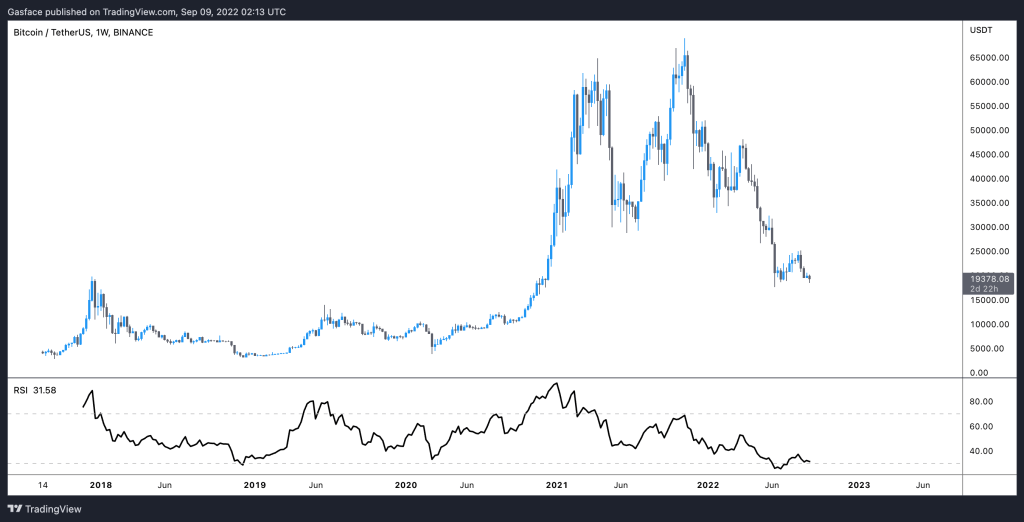
Currently the price of BTC is below 350DMA and similar to the 2-year MA multiplier. According to experts, averaging the dollar cost with low levels is a smart way to build a BTC position. Also, when we take a look at Bitcoin’s one-week relative strength index (RSI), we see that the asset is almost oversold. According to Big Smokey, when comparing the weekly RSI to the candlestick chart of BTC, it is clear that accumulation during oversold periods is also a profitable tactic.
Bitcoin’s MVRV Z-score
The on-chain indicator, called MVRV, recently hit its lowest score since 2015. This metric essentially refers to the realized market value of BTC’s market value. That is, the amount people are paying for BTC and its ratio compared to the current value of the asset. According to Jarvis Labs analyst “JJ”, Bitcoin’s MVRV (market cap vs market cap) indicator is recording extremely low data.
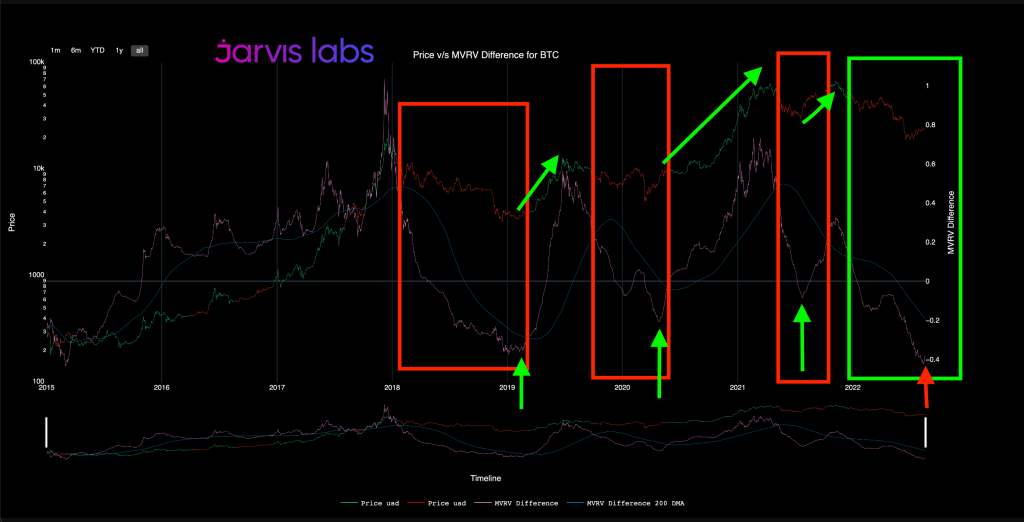
The MVRV Z-score gives insight into when Bitcoin is undervalued and when overvalued. According to analytics firm Glassnode, “when market value was significantly higher than realized value, it historically showed a market peak (red zone) while the opposite showed market bottom (green zone)”.
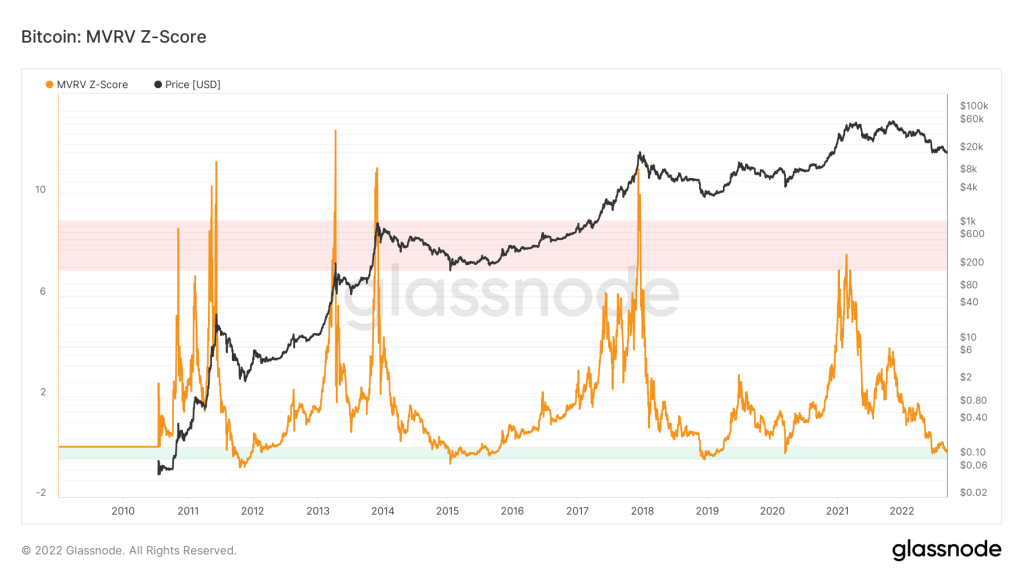
Compared to BTC, the MVRV score of -0.16 is in the same range as previous multi-year and cyclical lows for Bitcoin. According to experts, the data indicates that Bitcoin is in the midst of bottoming out. It also indicates that it is possibly entering the early stages of accumulation.