Bitcoin (BTC) continues to face strong resistance at its 50-day moving average, which currently sits at $34,000.
The cryptocurrency has been anchored to the $30,000 price level over the past two weeks, absorbing a majority of trading volume. That could point to volatile price moves later this month.
On the daily chart, bitcoin’s relative strength index (RSI) is stuck below the 50 neutral mark, which indicates slowing momentum behind the recent upswing in price. The persistent decline in momentum means BTC’s six-month downtrend remains intact.
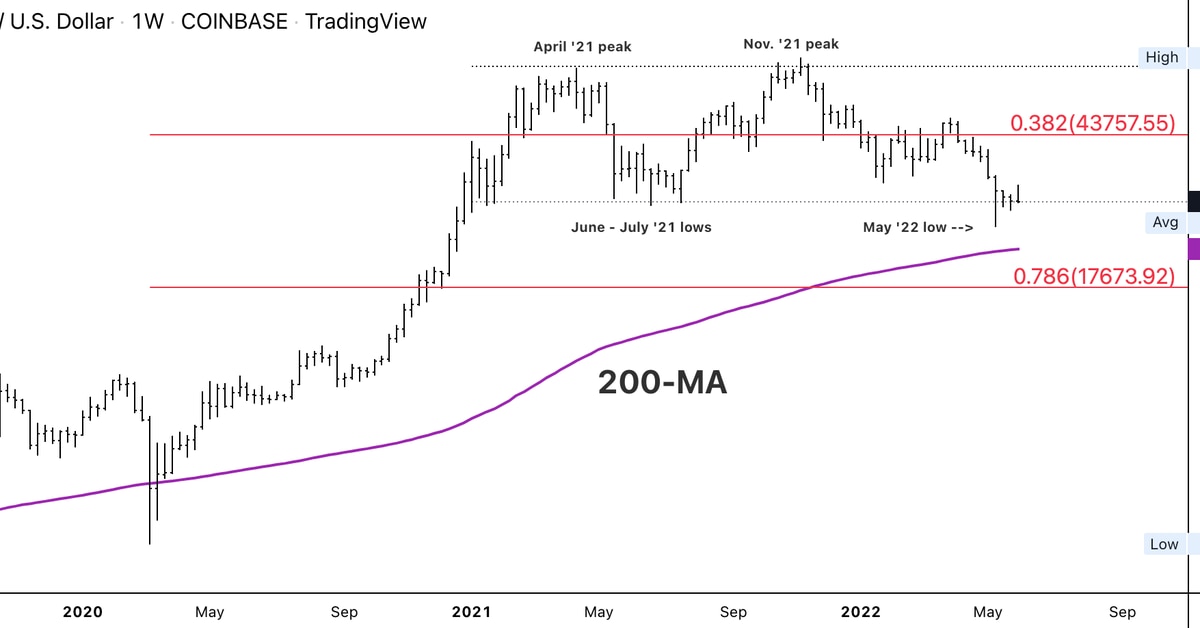
The weekly RSI is the most oversold since March 2020, which preceded an uptrend in price. This time, however, upside appears to be limited because of negative long-term momentum signals.
Still, over the short-term, BTC could stabilize above the $20,000-$25,000 support zone. The 200-week moving average, currently at $22,179, is another gauge of long-term trend support.
BTC is on watch for a countertrend bullish signal, per the DeMark indicators, which could appear over the next two weeks. That could pave the way for a short-term price bounce, which would delay additional breakdowns on the chart. Upside moves could be fleeting, however, with secondary support at $17,673 providing a more stable ground for capitulation.
Read more about
Save a Seat Now
 BTC$29,481.45
2.46%
 ETH$1,747.95
3.89%
 BNB$296.63
2.57%
 XRP$0.384856
3.50%
 LUNA$0.003772
62.96%
View All Prices
Sign up for First Mover, our daily newsletter putting the latest moves in crypto markets in context.


