Bitcoin (BTC) has come under pressure of late amid weakness in technology stocks and an uptick in bond yields. The pullback has some analysts focusing on a key average of bitcoin’s price for cues about the next possible move in the cryptocurrency.
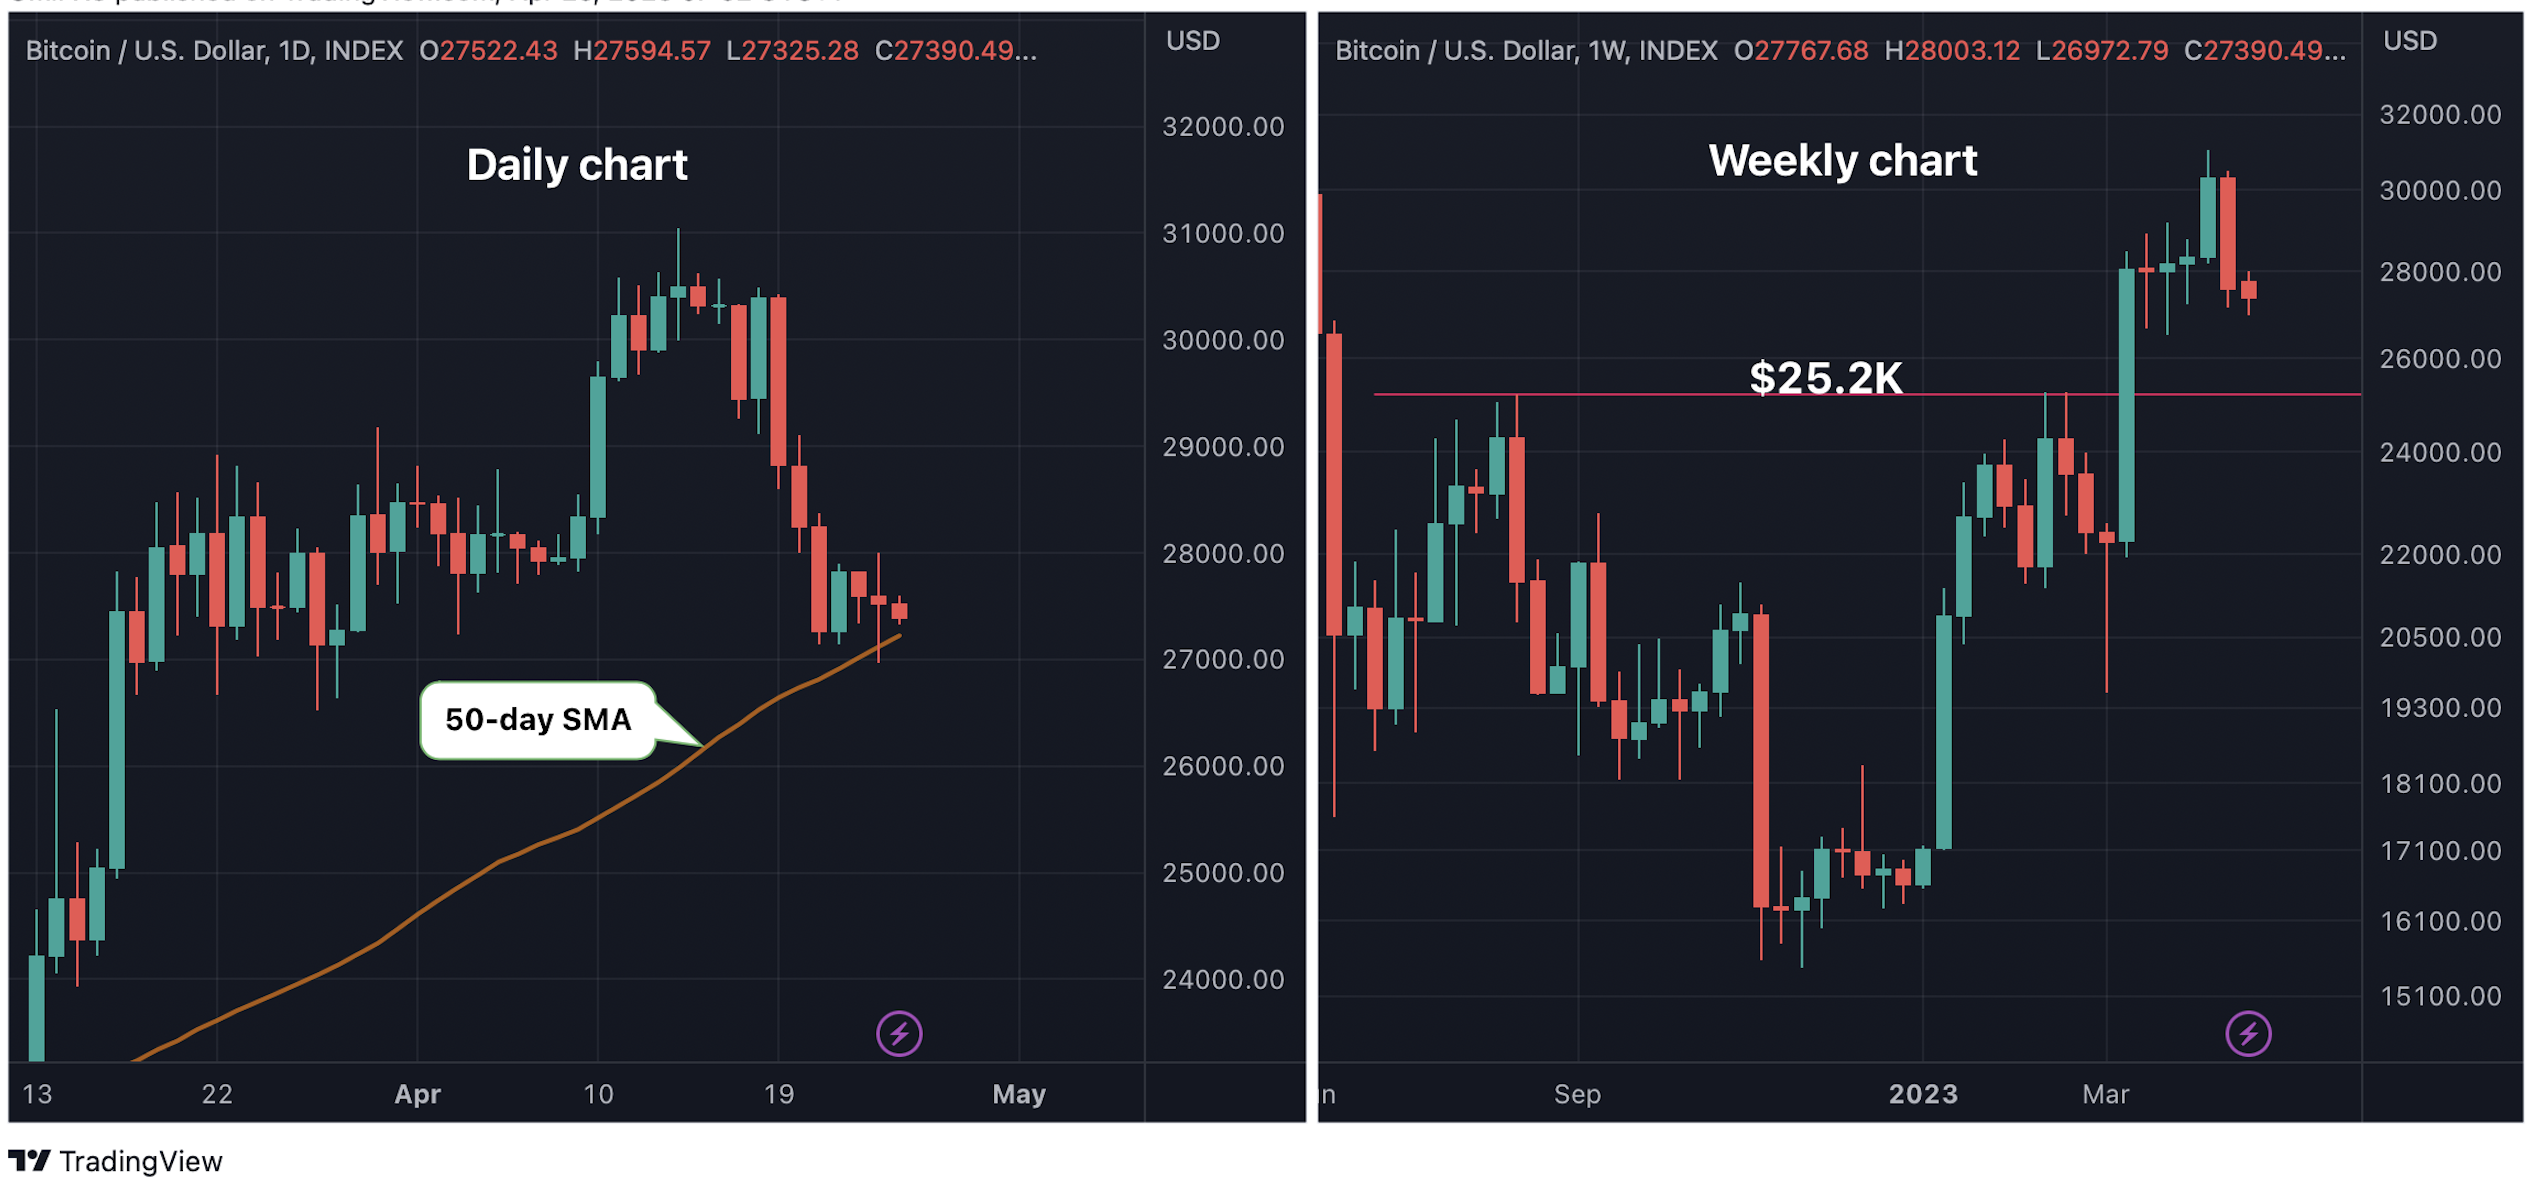
The leading cryptocurrency by market value traded at $27,400 at press time, down 11% from the ten-month high of $31,000 reached on April 14, CoinDesk data show. The decline has brought attention to bitcoin’s 50-day simple moving average (SMA), currently at $27,244.
According to Alex Kuptsikevich, senior market analyst at FxPro, a potential violation of the 50-day SMA support would challenge the bullish market sentiment.
“The market has erased its previous growth momentum and is now testing the strength of the medium-term uptrend in the form of the 50-day moving average,” Kuptsikevich said in an email. “A break below this would call into question the bull market’s strength, while a consolidation below $26,600 could be the prologue to a more profound decline.”
The 50-day SMA is one of the most widely-tracked technical lines in traditional markets and cryptocurrencies. Crypto analysts have previously tracked crossovers above/below the key average to confirm bullish and bearish trend changes.

Charts show a potential break below the 50-day SMA would expose former resistance-turned-support at $25,200. (CoinDesk/TradingView) (CoinDesk/TradingView)
Sellers tired to penetrate the 50-day SMA on Monday but failed. If the breakdown happens, the focus would shift to the next support at $25,200 – the level that capped the upside between August 2022 and February 2023, as seen in the weekly chart above.
According to Katie Stockton, founder and managing partner at Fairlead Strategies, the SMA support may be fleeting and could soon pave the way to a deeper decline.
“Bitcoin is testing the 50-day SMA, a minor level where short-term oversold conditions should generate a brief pause before bitcoin resumes lower toward key support (~$25,200),” Stockton said in a note to clients late Monday.
Oversold conditions illustrate a notable and consistent downward move in price over a specified period of time without much pullback. Technical analysts use indicators like the relative strength index and stochastic to gauge overbought/oversold conditions over different time frame charts (daily, weekly, hourly).
That said, if the SMA continues to hold ground, a new leg higher consistent with the broader bullish outlook will likely resume.
Recommended for you:
- Wassies NFT Prices Surge as Crypto Twitter Lore-Themed Hotel Opens in Singapore
- What the Tornado Cash Sanction Means for Privacy Coins
- Skyweaver Is a Great Blockchain Game, and an OK Regular Game
- Join the Most Important Conversation in Crypto and Web3 in Austin, Texas April 26-28
“The recent breakout [March move above $25,200] and positive weekly MACD support a bullish intermediate-term bias, with next major resistance near $35,900,” Stockton noted.


