According to the latest report from CEX.IO, it is possible for Cardano to drop to $0.24. Crypto analyst Filip L expects Ethereum to drop by 25% and flirt with a $1,000 barrier. Meanwhile, the analyst says Tezos will likely double its weekly loss. Analyst John Isige notes that a 13.52% drop for Litecoin is not a bad idea. We have compiled altcoin forecasts and analysis for our readers.
33% drop expectation for altcoin
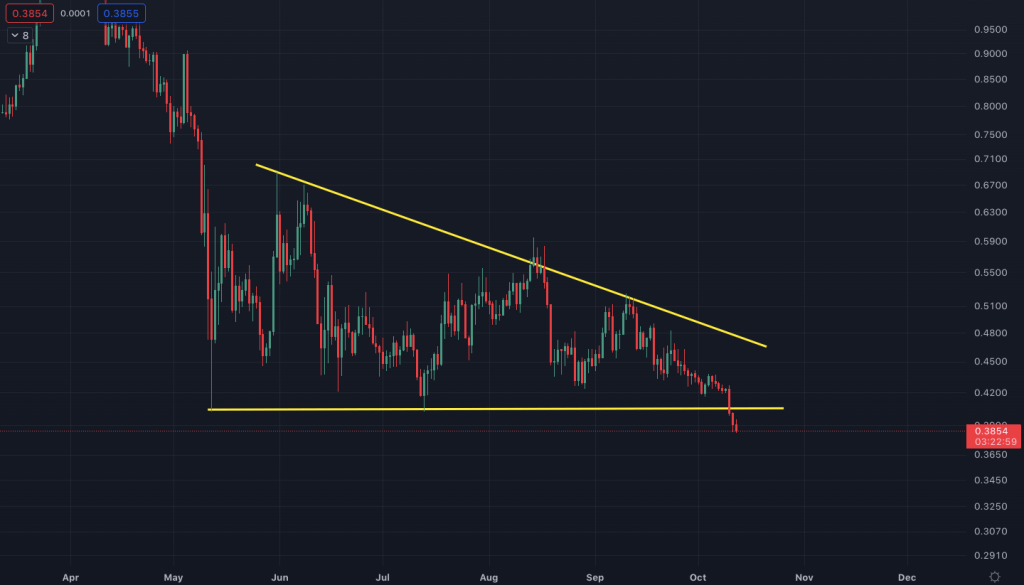
According to a new report by crypto exchange CEX.IO, it is possible for Cardano to drop to $0.24.
 Source: Tradingview
The cryptocurrency has entered an already collapsing sinister-looking descending triangle. If this bearish pattern materialises, it’s possible that ADA is down another 33% from where it’s currently trading. ADA has dropped more than 4% in the last 24 hours. The altcoin is trading at $0.3728 at press time.
“Leading altcoin starts flirting again with year low”
Ethereum price action is no different from the S&P 500, Dow Jones Index or US bond prices. All are falling drastically under the pressure of the stronger dollar. If a perfect storm starts to form under these conditions, the risk is high. In this case, it is possible for ETH to drop below $1,100 and seek $1,000 very soon.
ETH is likely to find support at the monthly S1 support level at $1,100. In addition, the Relative Strength Index (RSI) is approaching the oversold area. This indicates that the selling pressure is easing. But even if the RSI trade is firmly in the oversold territory, it is still possible for ETH to go to $1,100 or $1,000 by the end of the week, triggered by shifts in economic data. The bitter trade is still not over for crypto bulls. So a comeback for this year seems impossible.
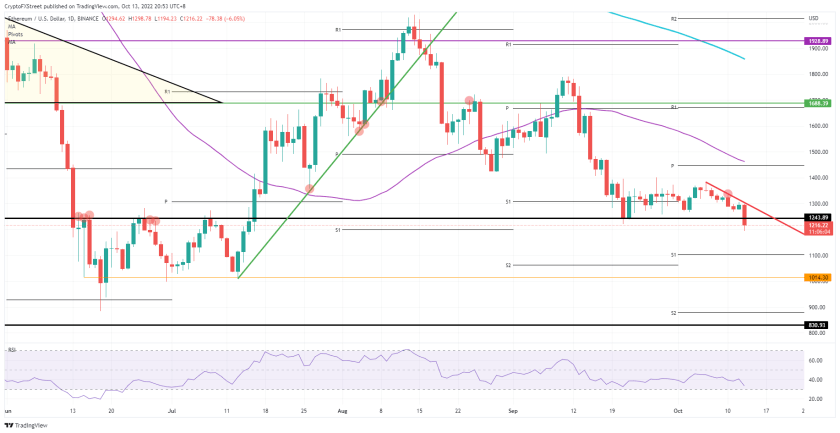 ETH/USD Daily chart
Alternatively, if the dust calms down after trades attempt to take some risky positions, it’s likely to rise a bit more. Additional motivation is likely to come from the RSI approaching the oversold zone. In such a scenario, traders can expect a reversal to the red descending trendline followed by an approach to $1,300.
“New lows for the year possible for XTZ”
Tezos is already taking a heavy hit this week with an 8% negative performance. cryptocoin.com As you can follow, US CPI data came in above expectations. So, it’s possible that this data of yours completes the car crash. This will likely force XTZ price action further down.
XTZ’s price will fall below the monthly S1 support level in such a scenario. The June low will seek the next support at $1.19. This level has a high risk of breaking from a sharp nose dive. However, it is possible for the bulls to hold $1.15 and monthly S2 trigger a bounce. On the other hand, don’t expect this bounce to hold any good cards. Because it will be there to allow the Relative Strength Index to cool down after oversold trades.
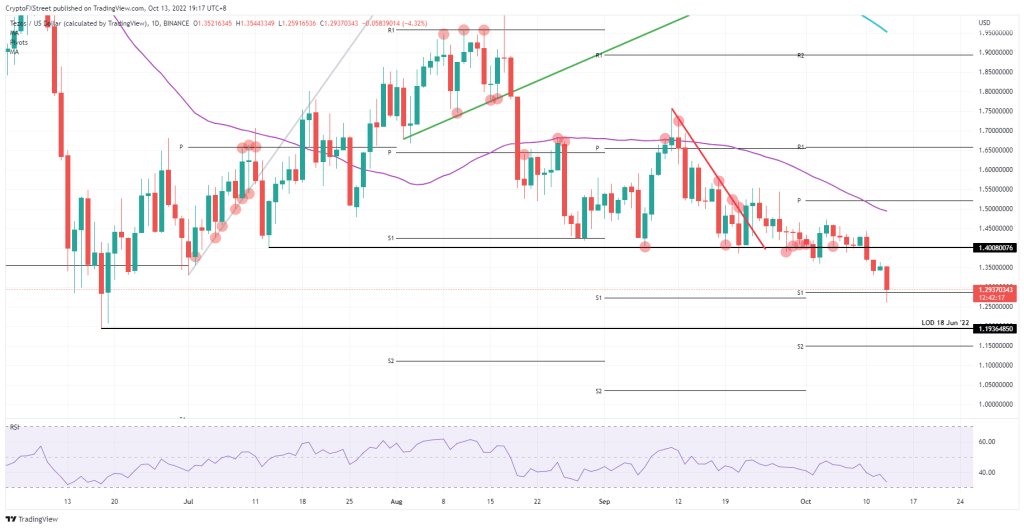 XTZ daily chart
Of course, the reverse is also possible. Because the economic numbers are so binary, markets would welcome a sharp drop in inflation. This is what it means, for example, when US inflation falls from 8.3% to 6% or less. Depending on the sharpness of the drop, it will take a big step back. In this case, it is possible for XTZ to rise to $1.40.
“Litecoin price hunt for the bottom continues”
Litecoin settled above the $50.00 support in mid-September after earlier rejection at $67.50. The bulls moved quickly to regain lost ground. But overhead pressure of $58.00 hindered their progress. The contention between the bulls and bears continued for most of the first two weeks of October. This represented itself on the chart as a symmetrical triangle pattern.
A break from the triangle pattern predicted Litecoin to drop to $46.64, according to last week’s analysis. A break below the lower trendline of the triangle confirmed the expected breakout on Monday. Thus, it left the altcoin price vulnerable to a downtrend.
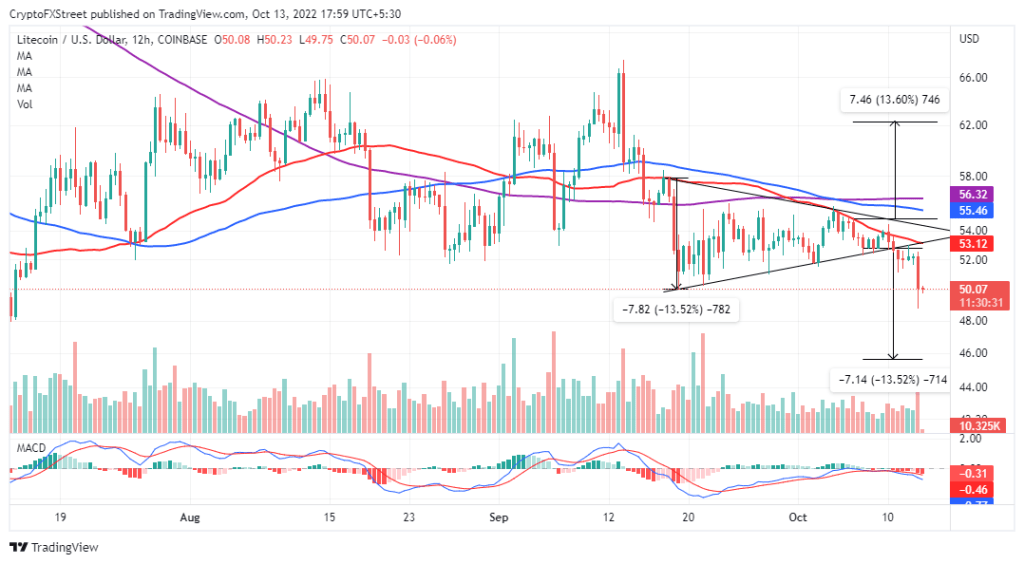 LTC 12 hour chart
Litecoin is trading at $48.88 after a 7.02% drop from the breakout point of the triangle. Altcoin technical outlook points to further bearish to complete the 13.52% target formed by the breakout point of the triangle. However, a 12-hour daily close above $50.00 will invalidate any possible losses to $46.64.
The MACD (Moving Average Convergence Divergence) indicator supports the pessimistic narrative. A sell signal on Monday following the 12-day EMA (Exponential Moving Average) seems to be calling for more sellers into the market. As long as the MACD stays below the average line (MACD) and on a downward slope, Litecoin will tend to fall lower.
What does the IOMAP chart show for altcoin?
According to IntoTheBlock’s IOMAP chart, Litecoin’s rapid recovery remains a pipe dream. Nearly 400,500 addresses that bought LTC at around $52.60 are trying to break even into losing positions as the altcoin tries to recover. As a result, they may consider selling at this level while slowing down the uptrend. This battle between buyers and sellers will continue from $53.97, $55.43 and $57.02 to $60.00, according to the IOMAP investor group.
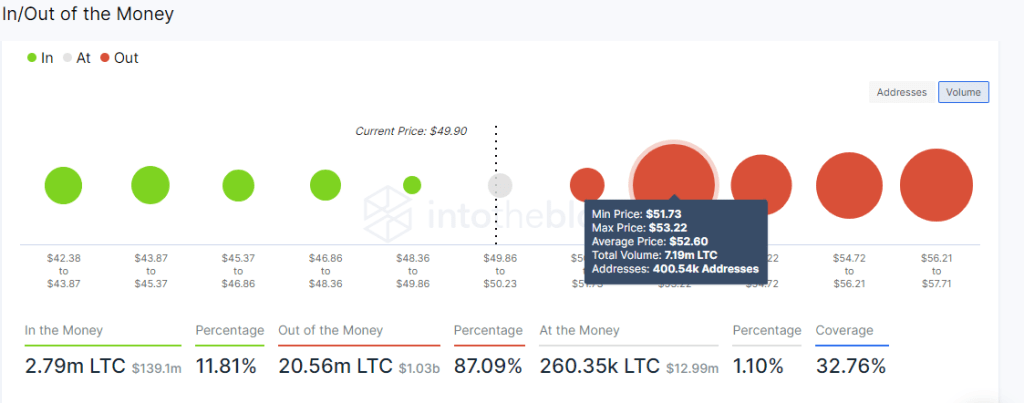 Litecoin IOMAP chart
On the other hand, the IOMAP model reveals that Litecoin does not have solid support to mitigate the ongoing pullback. It also indicates that it will fall further. Still, Litecoin’s rally to $46.64 will give buyers time to gather more liquidity before attacking higher highs towards $100. Therefore, it will be a blessing in disguise for those who stubbornly ascend.


