
The cryptocurrency market rallied ahead of the FOMC meeting on July 27. But will the expected 75bps increase limit the current rally? To answer, let’s look at crypto analyst Rakesh Upadhyay’s analysis for BTC, DOGE, AVAX, XRP, DOT and 5 altcoins.
An overview of global markets
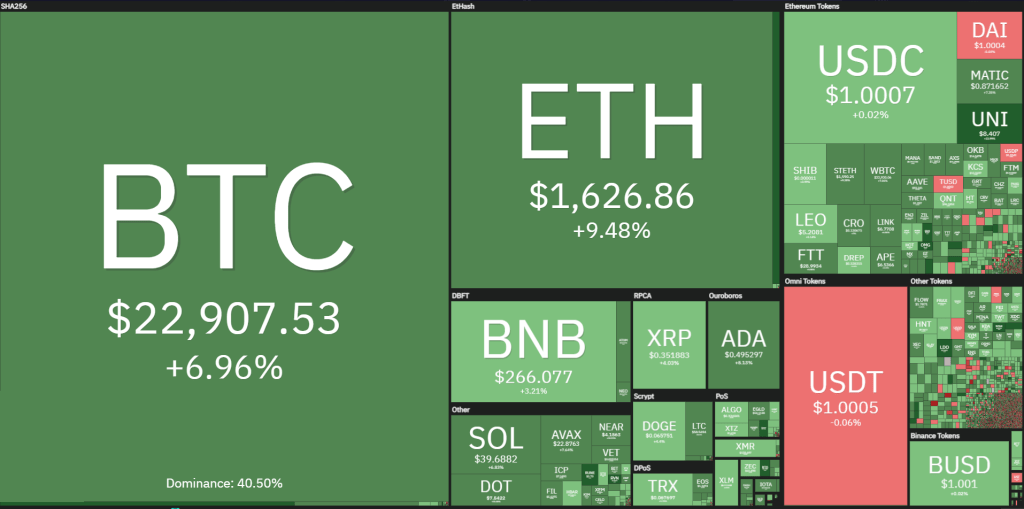
US equities and crypto markets are entering the Fed’s interest rate decision on July 27 on a positive note. This indicates that market participants believe the Fed will raise rates by 75 basis points in line with market expectations.
Some economists expect the Fed to calm markets by pointing to less aggressive rate hikes in the future. Trading firm QCP Capital said the market response has been positive at all Federal Open Market Committee meetings this year, and they expect the same at the most recent meeting.
Analysts are split on the next directional move for Bitcoin. Once the event has passed, some expect Bitcoin to drop from the current level and drop to new year lows, while others expect the recovery to pick up speed. Do the charts support an aid rally or further declines? Let’s look at the technical analysis of crypto analyst Rakesh Upadhyay to find out.
Bitcoin (BTC)
Bitcoin dropped below $21,738 on July 25 and re-entered the symmetrical triangle pattern. This indicates that the final breakout from the triangle is likely to be a bull trap.
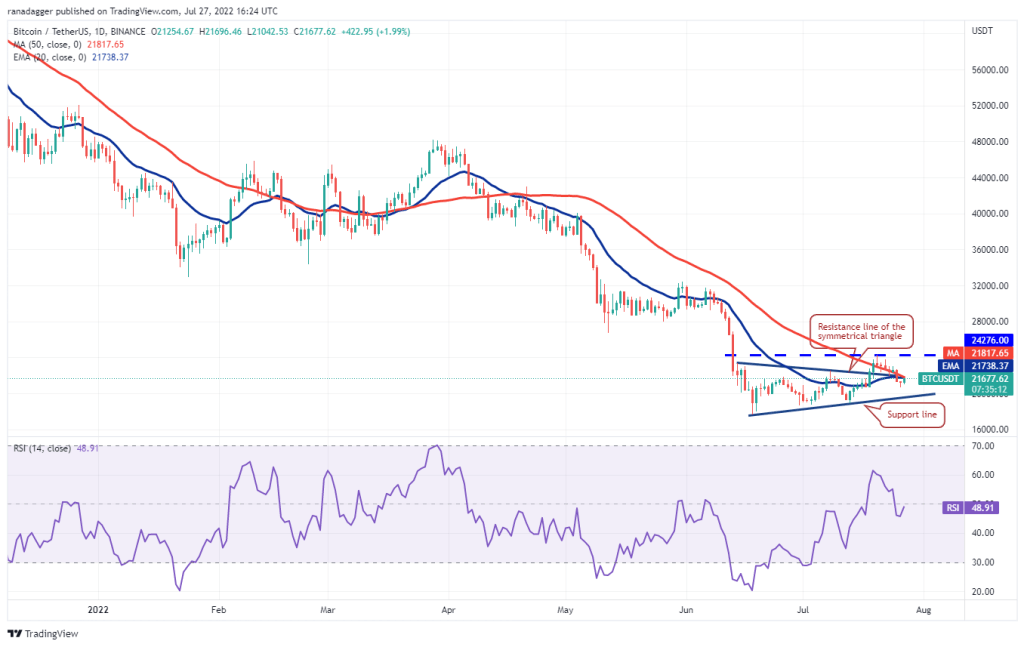
The 20-day EMA has flattened and the relative strength index (RSI) is just below the midpoint. This shows that there is a range-dependent action in the near term. According to the analyst, BTC could be stuck between the support line and $24,276 for several days. If buyers push the price above the moving averages, the BTC/USDT pair will head towards the overhead resistance at $24,276. The bulls have to break through this hurdle to signal the start of a new upward move. Conversely, if the price drops from the moving averages, the bears will try to pull the pair to the support line. A break below this level opens the doors for a possible drop to $18,626 and then to $17,622.
Ethereum (ETH)
ETH bounced back from overhead resistance and dropped to $1,406 on July 26. The long tail candle indicates strong buying at the lower levels.
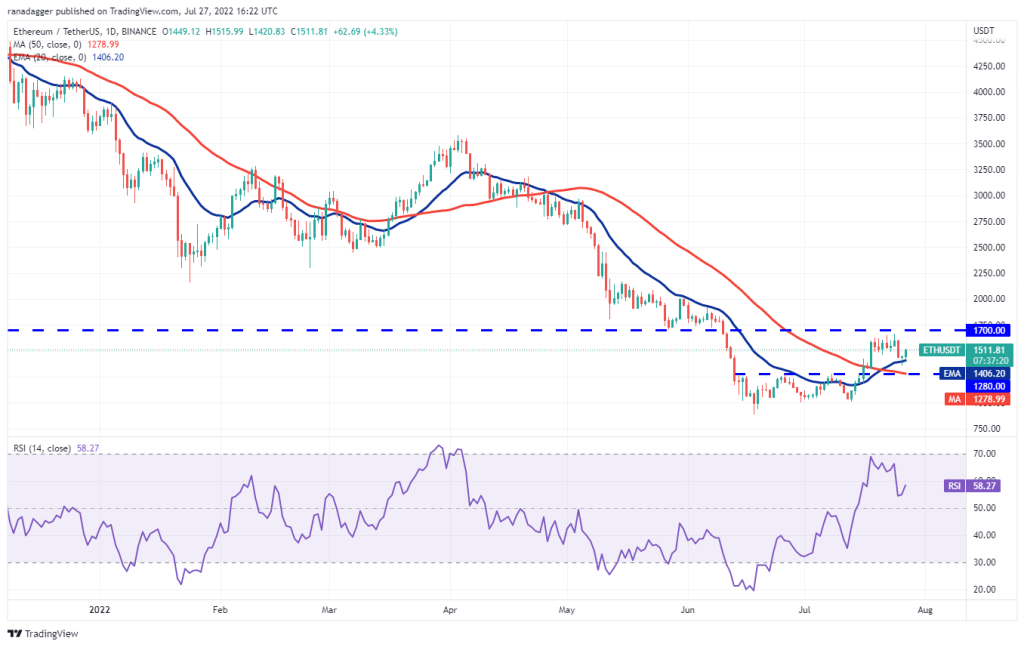
The bulls will now try to push the price towards the overhead resistance at $1,700. This is an important level to watch out for. Because a break and close above this will signal a potential change in trend. According to the analyst, the ETH/USDT pair will then head towards $2,000.
On the contrary, if the bulls fail to make a strong recovery from the 20-day EMA, it will indicate a lack of aggressive buying. This increases the probability of a drop to $1,280. A strong rebound from this level signals a range-bound move in the near-term. However, a break below this will drop ETH to $1,000.
BNB Coin (BNB)
The BNB chart rebounded at $239 on July 26, showing the bulls attempting to turn this level into support. Buyers push the price above $250 and will try to challenge the downtrend line.
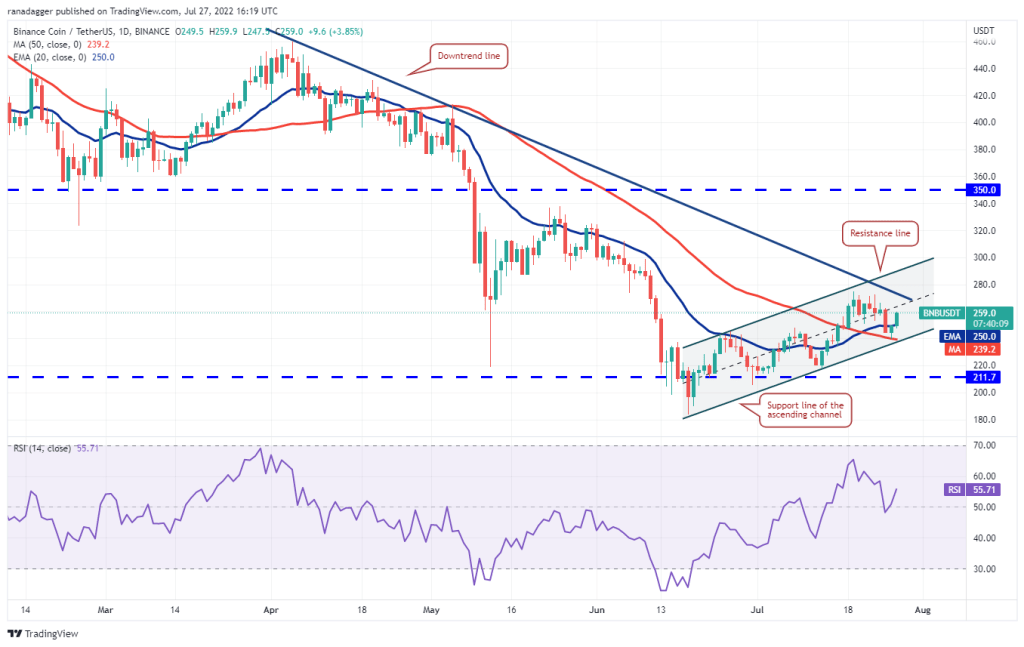
If the bulls push the price above the downtrend line, it will suggest a potential change in trend. The BNB/USDT pair will then head towards the resistance line of the ascending channel where the bears can form a strong defense. Alternatively, if the price drops from the current level, it will indicate that the bears are active at higher levels. Sellers will then make another attempt to sink the pair below the support line of the channel. If they do, BNB price will gain momentum towards strong support at $211.
XRP
XRP fell below the moving averages on July 25, opening the door for a possible drop to the strong support at $0.30. In a range, traders usually buy near the support and sell at the resistance.
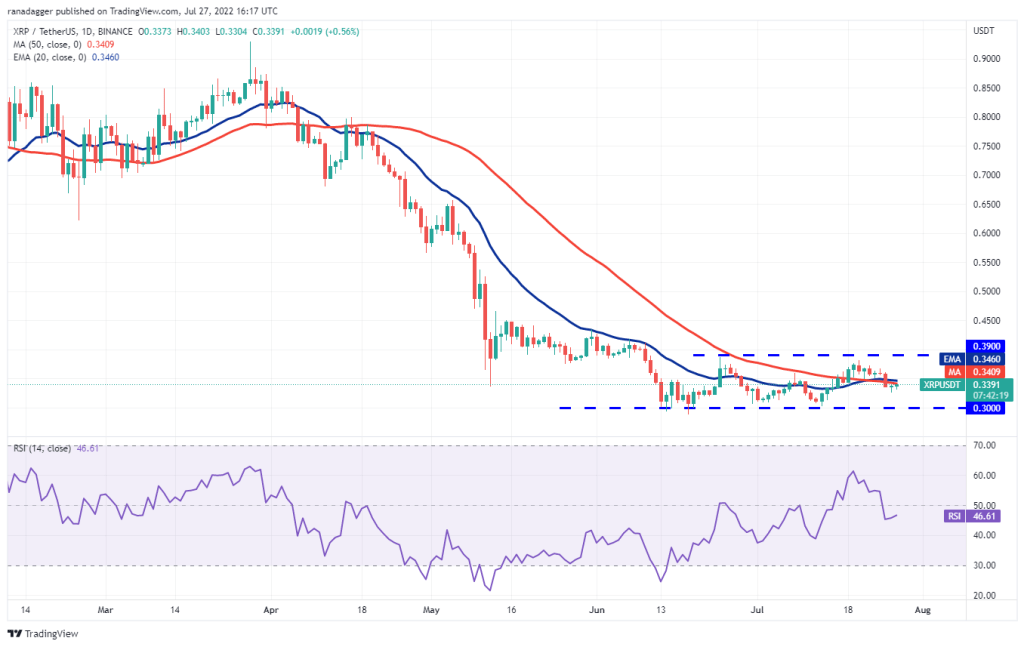
Therefore, the bulls are likely to defend the $0.30 level aggressively. A strong recovery from this level will keep the XRP/USDT range between $0.30 and $0.39 for a few days. The horizontal moving averages and the RSI just below the midpoint point to a consolidation in the near term.
The next trend move will start after the bears push the price below $0.30 or the bulls push XRP above $0.39. Until then, temporary range-bound action is likely to continue.
Cardano (ADA)
Cardano (ADA) fell below the moving averages on July 25 and closed. The bears tried to push the price below the strong support at $0.44 but the bulls held their ground.
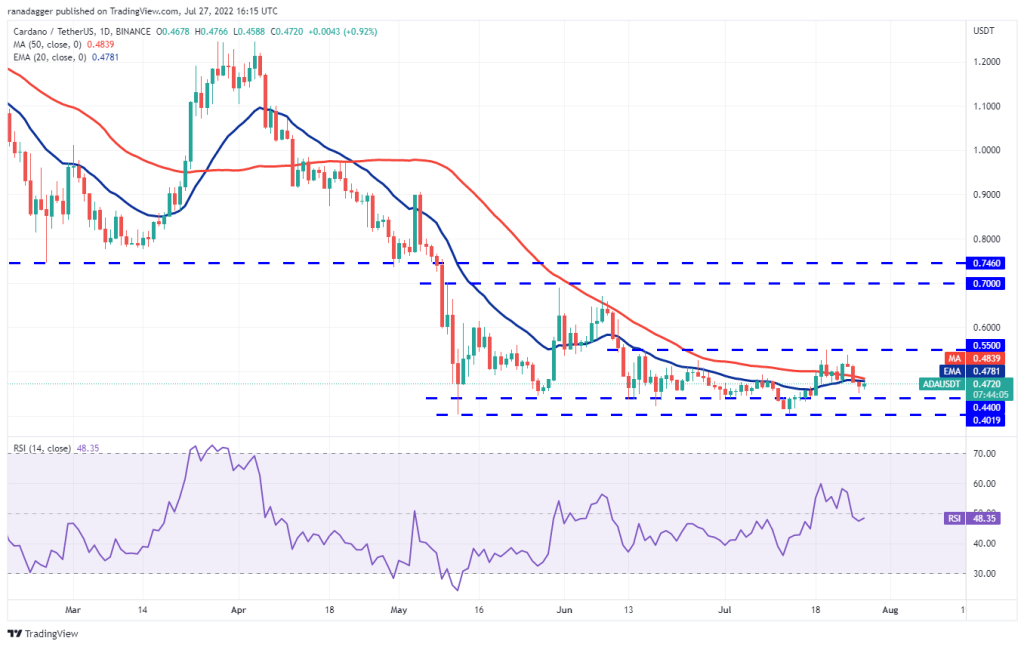
Buyers are trying to push the price above the moving averages. If they do, the ADA price will rise to the overhead resistance at $0.55. Bears need to build a strong defense at this level. However, if the bulls break this resistance, ADA will head towards $0.63 and then $0.70. Conversely, if the price declines from the moving averages and dips below $0.44, the next stop is $0.40. A break below this level suggests a resumption of the downtrend.
Left (LEFT)
cryptocoin.com As we covered in our analysis, Solana (SOL) price dropped below the moving averages and reached the support line on July 26. The bulls are trying to hold the level but are struggling to push the price above the moving averages.
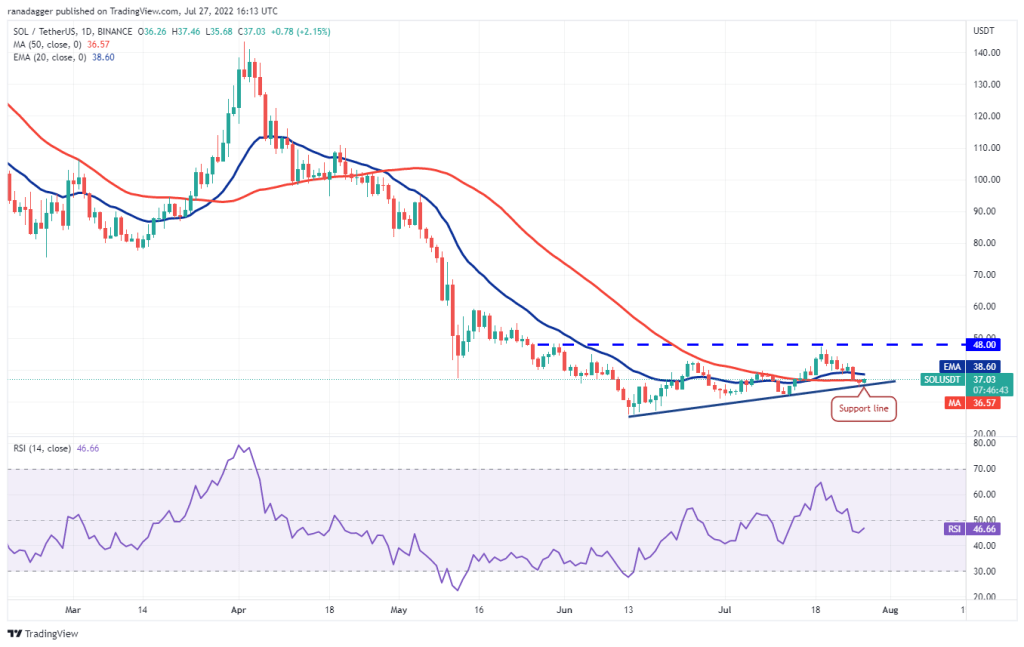
This indicates that demand is drying up at higher levels. On the other hand, the 20-day EMA ($38) is horizontal and the RSI is just below the midpoint, showing the balance between buyers and sellers. This advantage will turn in favor of the bears if the price breaks and drops below the support line. If that happens, SOL bears will push the price down to $30.
To invalidate this bearish view, buyers need to push the price above the 20-day EMA. If they do, the SOL price will reach the overhead resistance at $48. A break and close above this level will complete the ascending triangle pattern with a target target of $71.
Dogecoin (DOGE)
Dogecoin (DOGE) fell below the trendline on July 26. But the bears failed to sustain lower levels. The bulls bought the dip and pushed the price back into the ascending triangle.
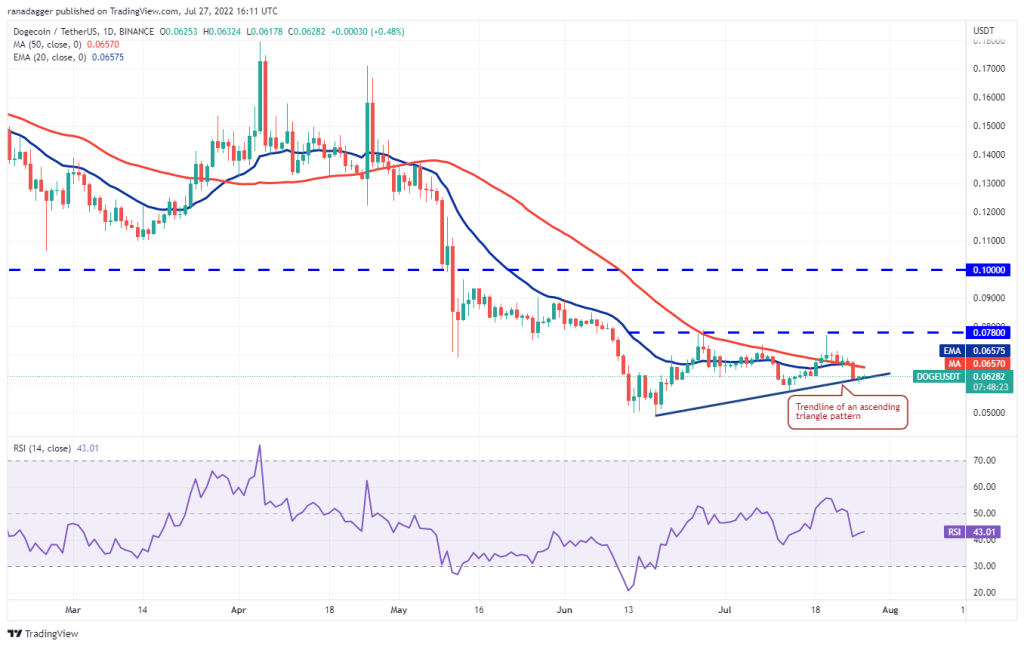
The moving averages have started to drop and the RSI is in the negative territory. This shows that the bears are superior. If the price drops and dips below the trendline, the probability of a drop to $0.05 increases. Contrary to this assumption, if the price rises from the current level and rises above the moving averages, DOGE price will rise to the overhead resistance at $0.08. The bulls will have to break through this hurdle to complete the ascending triangle pattern. According to the analyst, the price will then head towards the formation target at $0.11.
Polkadot (DOT)
Polkadot (DOT) has been trading between $6 and $7.36, which is critical support for the past few days. Although $7.13 is stable, the RSI in the negative territory points to a slight advantage for sellers.
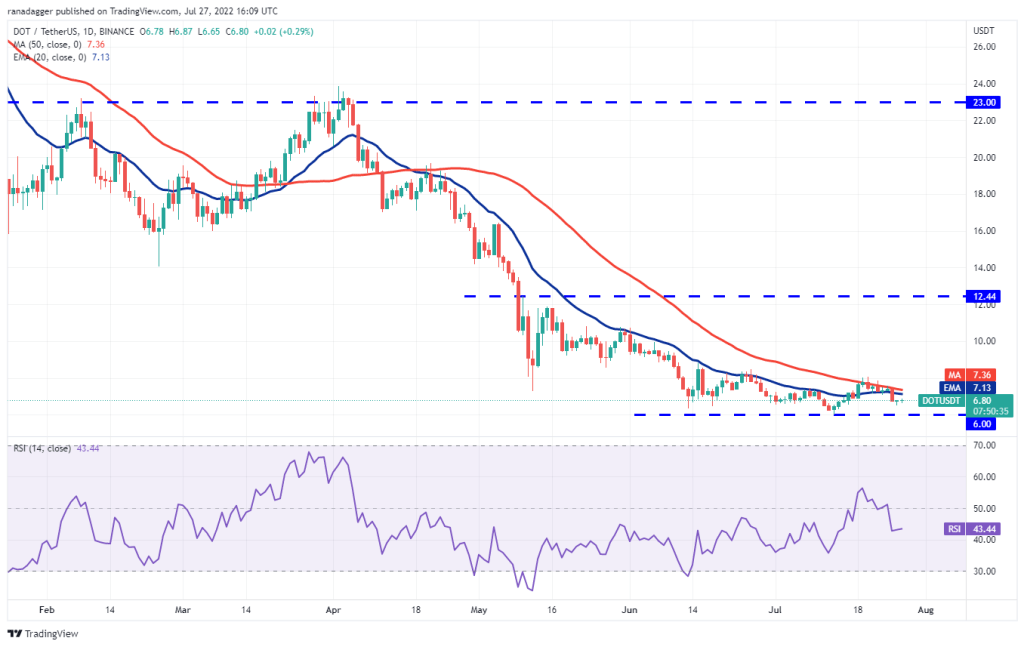
If the price breaks from the current level or the 50-day SMA, the bears will make another attempt to break the DOT/USDT pair below $6. If successful, the pair could start the next leg of the downtrend.
On the other hand, if the price rises and rises above the 50-day SMA, it will indicate lower levels of demand. DOT will then try $8.79, where the bears could offer stiff resistance again. A break and close above this level will open the doors to $10.
Polygon (MATIC)
MATIC fell below $0.75 on July 26. However, the bulls bought the dip as seen from the long tail on the day’s candlestick.
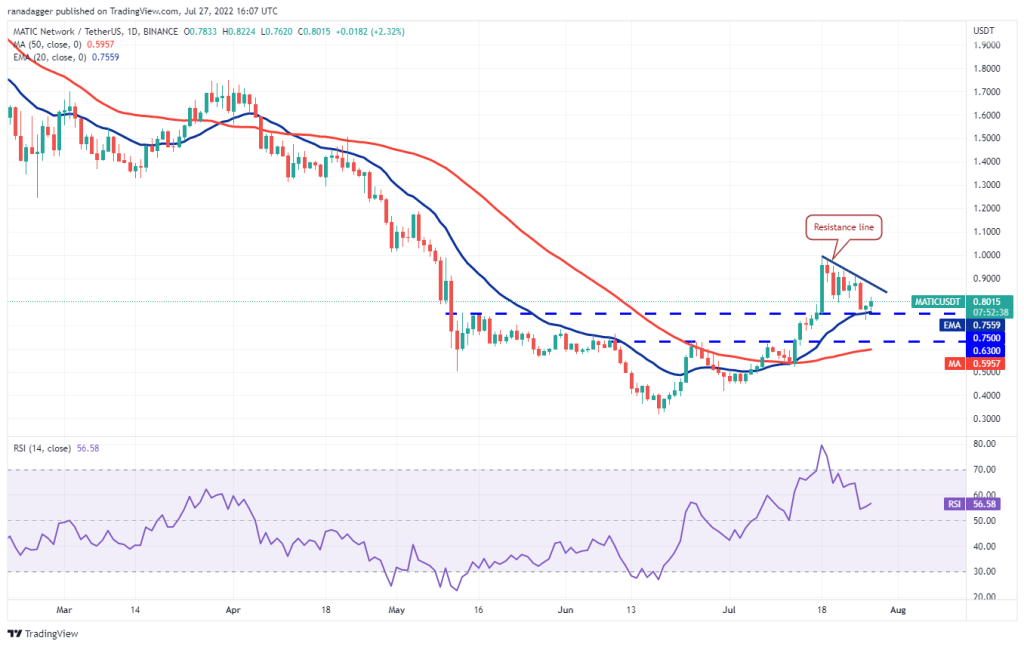
Buyers are trying to continue the uptrend, expecting strong selling at the resistance line. If the bulls break through this overall hurdle, the momentum will accelerate. According to the analyst, at this point, MATIC will head to the psychological level at $1. A close above this level opens the doors for a rally to $1.26. Contrary to this assumption, if the price turns down from the resistance line, it will increase the probability of a break below $0.75. If this happens, MATIC price will deepen to $0.63.
Avalanche (AVAX)
Avalanche (AVAX) broke below the $21.35 breakout level on July 25. This indicates that the AVAX bears are selling aggressively in the rallies. A minor positive is that the bulls are trying to defend $19.45.
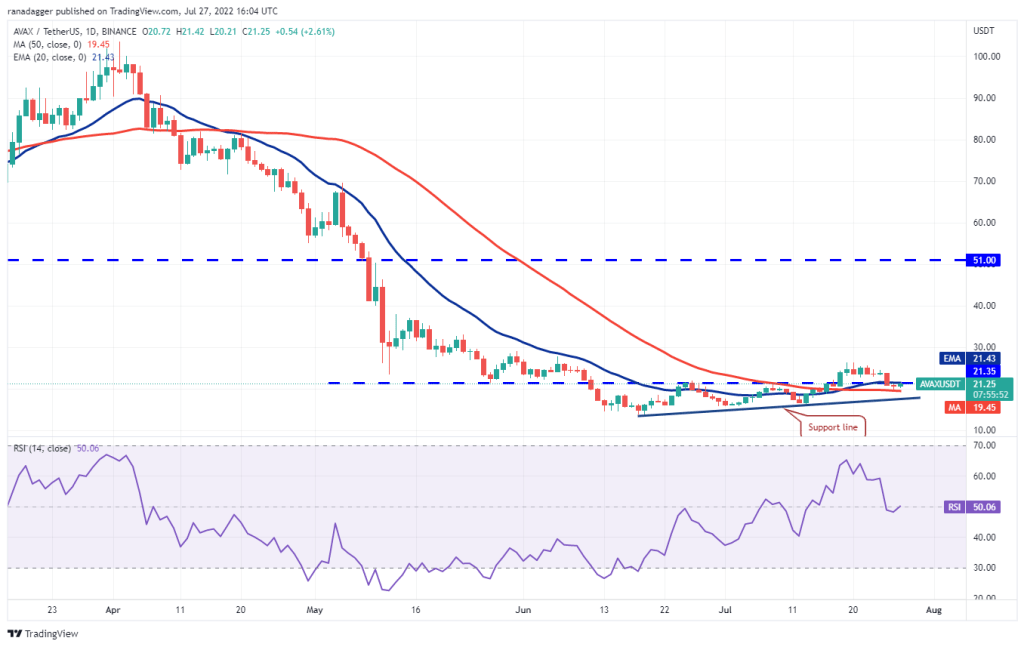
The 20-day EMA ($21.43) has flattened and the RSI is near the midpoint. This shows that there is a balance between supply and demand. If the price drops below the support line, this advantage will be in favor of the sellers.
On the contrary, if the index continues above the 20-day EMA, AVAX will gain momentum towards $26.50. The bulls will have to break through this overall hurdle to signal the resumption of the upward move. According to the analyst, the AVAX price will later increase towards $33.