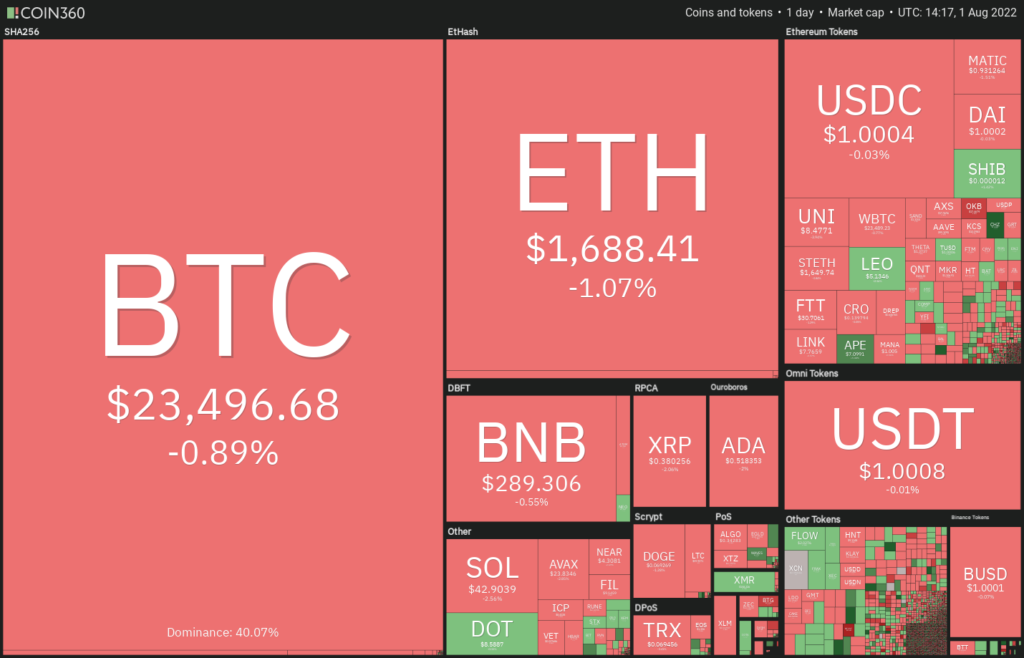
After strong monthly gains in July, Bitcoin (BTC) and altcoins started the new month with a temporary correction. Even US stock markets are experiencing a soft correction to August. Analysts in the crypto space are split on whether the recent rally is a bear market rally or the start of a new bull phase.
Trade levels for BTC, ETH, DOGE and these altcoins
However, the first BTC spot price exchange-traded fund (ETF) was the Purpose Bitcoin ETF to add 2,600 Bitcoin to its holdings. Total assets under management are well below all-time highs. However, the latest addition is a sign that some institutional investors may have started bottom hunting. So what levels should investors pay attention to for BTC, DOGE, ETH and the 7 leading altcoins? Let’s examine the charts of the top 10 cryptocurrencies to find out. cryptocoin.comwe have prepared for you.

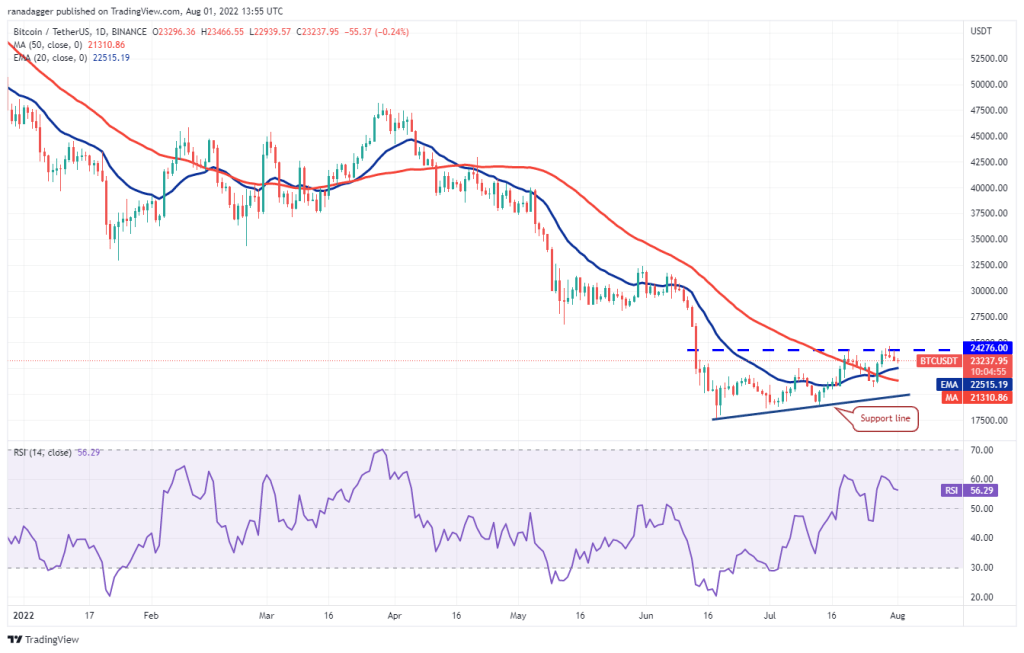
Bitcoin (BTC)
The bulls have been unable to sustain BTC price above the overhead resistance of $24,276 over the past few days. All in all, this shows that the bears are defending the low with all their might. The price dropped to the 20-day EMA ($22,515), which is likely to act as a strong support. If BTC rises above this level, the bulls will again try to break through the general hurdle. If successful, the pair is likely to gain momentum and make a rally to $28,171. The rising 20-day EMA and RSI in the positive zone point to the advantage for Bitcoin. This positive view could be invalidated if the price breaks below the 50-day SMA ($21,310). Accordingly, the pair is likely to drop to the support line, which is an important level for the bulls to defend.
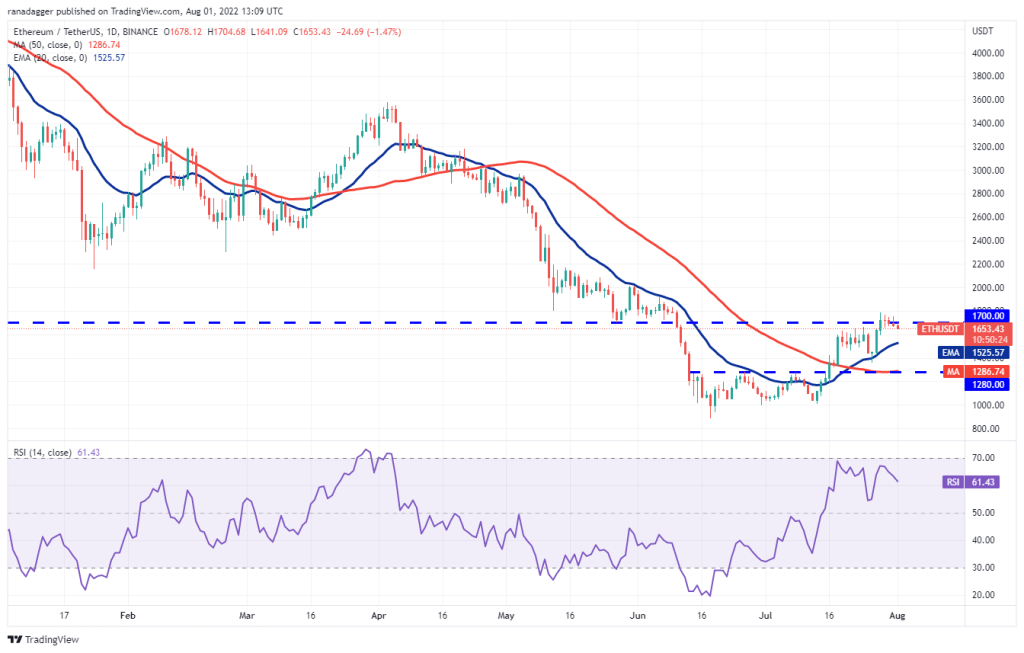
Ethereum (ETH)
Ethereum (ETH) is witnessing a tough battle near the key level at $1,700. This battle takes place between bulls and bears. Accordingly, the bulls have pushed the price above this level again in the past four days. However, they failed to continue the upward price action. As a result, the bears are trying to pull the price towards the important 20-day EMA ($1,525). If ETH rallies here, it will appear that sentiment has turned positive and traders are buying on the dips. This has the potential to increase the likelihood of a break above the $1,700 to $1,785 resistance zone. If this happens, it is possible for ETH/USDT to rally to $2,000 and then to $2,200. However, the price could also decline below the 20-day EMA. If this happens, it will show that the pair can remain stuck in the $1,280 to $1,785 range for a few days.
Binance Coin (BNB)
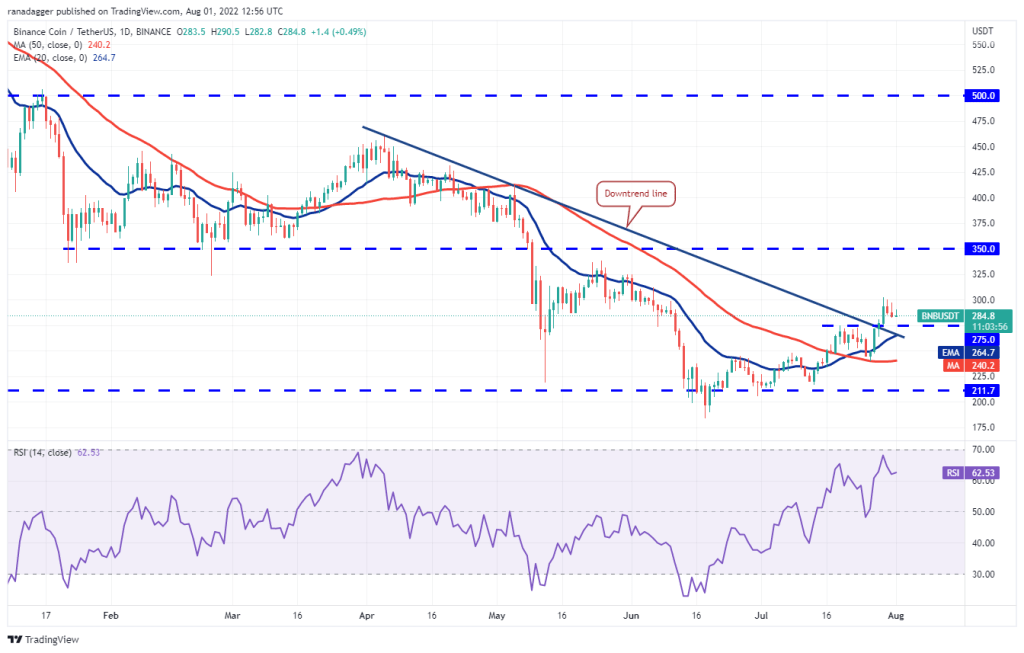
BNB’s recovery faces strong resistance at $300. However, the shallow pullback indicates that the bulls are not closing their positions in a hurry as they expect the uptrend to continue. The bulls will try to defend the zone between $275 and the 20-day EMA ($264). If the price bounces back from this zone, the bulls will try to push the BNB/USDT pair above $300 again. If they succeed in this, the pair will begin their march to the north. Accordingly, it is possible for the BNB price to target above $350. Additionally, this view will become invalid if the price drops. A break below the 20-day EMA has the potential to drop the price to the 50-day SMA ($240).
Ripple (XRP)
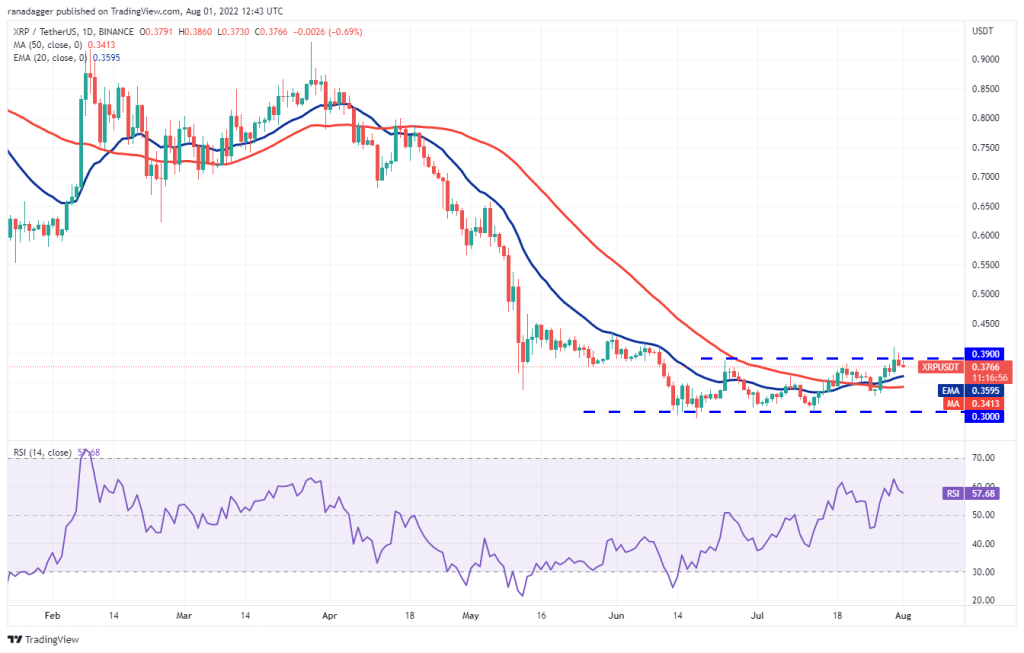
XRP price climbed above the overhead resistance of $0.39 on July 30 and 31. However, the bulls failed to sustain higher levels. This shows that the bears have not given up yet. It also reveals that it continues to aggressively defend the $0.39 level. The slowly rising 20-day EMA is located at $0.36. The RSI in the positive zone points to a slight advantage for buyers. If XRP rises from the 20-day EMA, it will increase the likelihood of a rally above the $0.39 to $0.41 range. If this happens, a rally to $0.48 is possible for the XRP/USDT pair. However, it is also possible for the price to drop below the 20-day EMA. Accordingly, we expect the pair to remain in the range for a few more days. If this happens, it will indicate that traders have booked profits. Additionally, a break below the 50-day SMA ($0.34) is also possible. This will open the doors for a drop to $0.30.
Cardano (ADA)
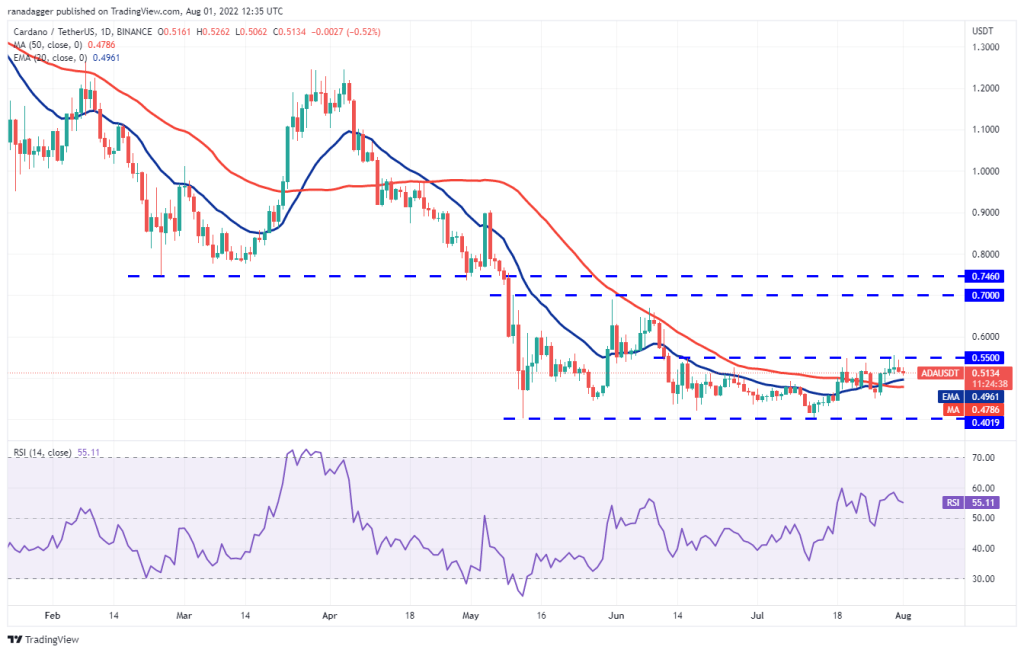
Cardano (ADA) bounced back from overhead resistance at $0.55 on July 30. Thus, he stated that the bears will not allow the bulls to continue their path. If Cardano breaks below the moving averages, the ADA/USDT pair is likely to drop to $0.45. Such a move would indicate that the pair could stay stuck between $0.40 and $0.55 for a few more days. However, it is possible for the price to bounce back from the moving averages. If this scenario happens, it will reveal that the bulls are buying on the dips. The bulls will then attempt to push the pair above $0.55 once again. If successful, the pair has the potential to rise to $0.63 and then to $0.70.
Left (LEFT)
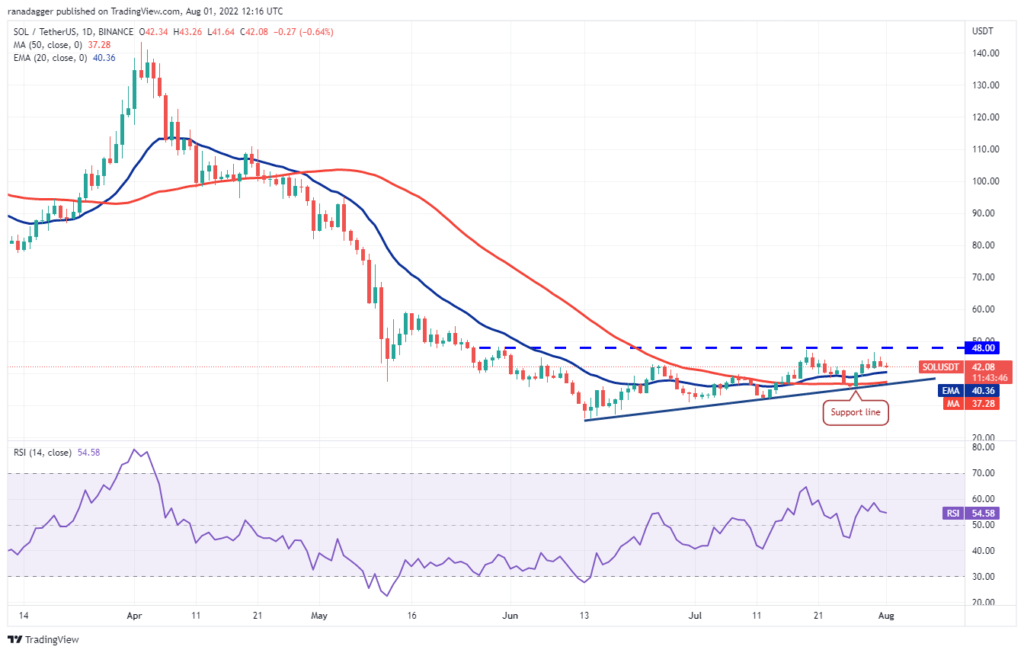
The bears thwarted the bulls’ attempt to push Solana (SOL) above the overhead resistance at $48. This has resulted in it attracting profit bookings from short-term investors. As a result, the price is likely to decline to the 20-day EMA ($40). If the price bounces back from the 20-day EMA, the bulls will make an attempt to push the SOL/USDT pair above the overhead resistance. If successful, the pair will complete the ascending triangle pattern with a target of $71. However, a drop below the 20-day EMA will cause the double triangle to challenge the support line. If this level gives way, the bullish setup will be rejected. So, it will open the doors for a drop to $30.
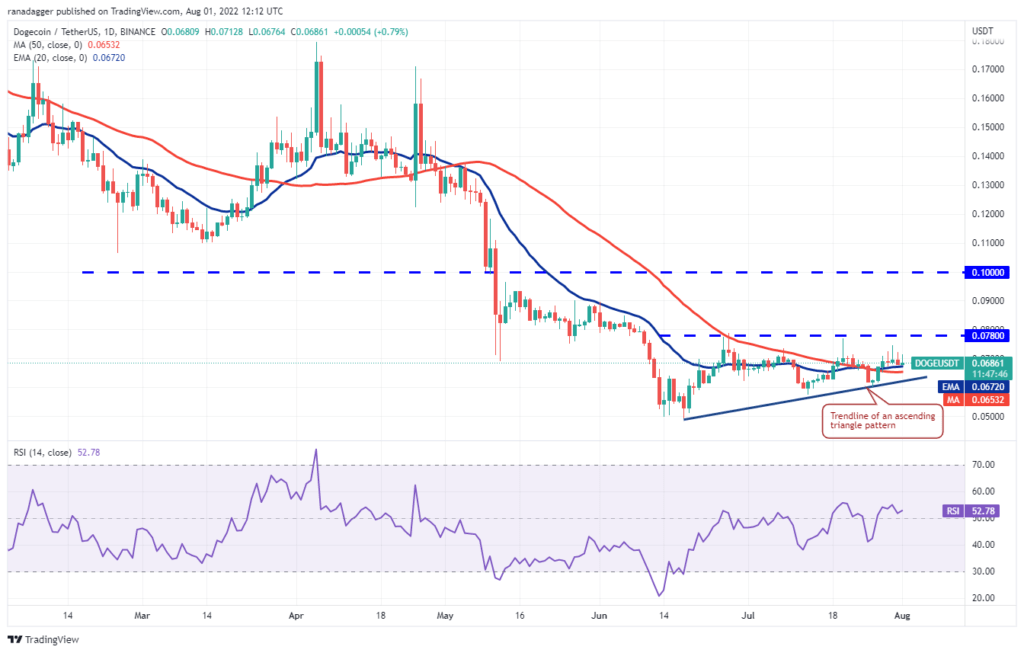
Dogecoin (DOGE)
The bulls tried to push Dogecoin (DOGE) above the overhead resistance at $0.08 but the bears had other plans. They sold higher and pulled the price back towards the moving averages. If the price continues to drop and dips below the moving averages, the trendline may be in danger of collapsing. If this happens, the developing ascending triangle pattern will be invalidated. This could turn the advantage in favor of the bears. Conversely, if the price bounces back from the moving averages, it indicates that the bulls are continuing to buy lower. The bulls will then attempt to push the DOGE above $0.08 and start a fresh upward move towards $0.10.
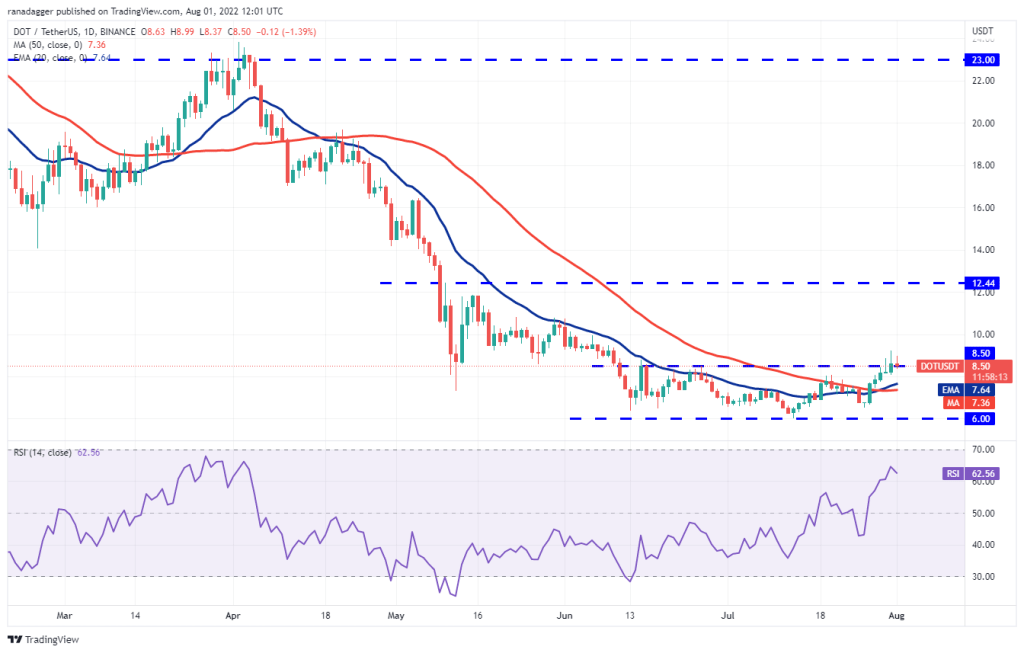
Polkadot (DOT)
Polkadot (DOT) broke above the overhead resistance of $8.50 on July 31 and closed. However, the long wick on the candlestick is selling at higher levels. The bears are trying to trap the aggressive bulls by pushing the price below the breakout level. If successful, the DOT/USDT pair will drop to the 20-day EMA ($7.64). This is an important level to consider. This is because a break and close below the level indicates that the pair could extend its stay between $6 and $8.50 for a few more days. Alternatively, if the price rises from the current level or the 20-day EMA, it will indicate that the bulls are buying on the dips. This could increase the likelihood of a rally to the $10 psychological level and then to $10.80.
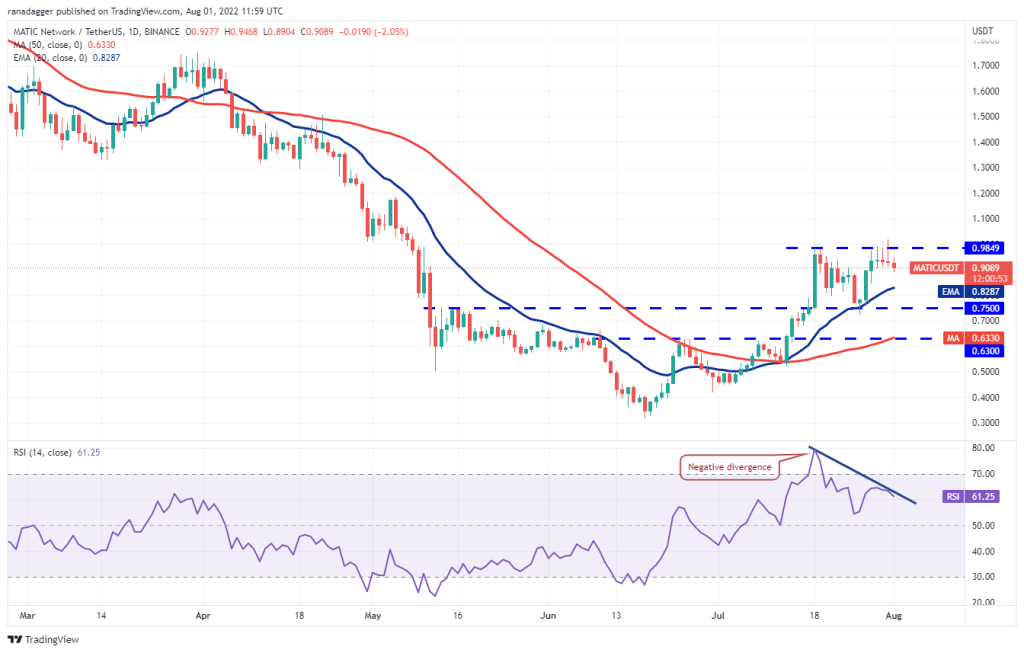
Polygon (MATIC)
Buyers pushed Polygon (MATIC) above psychological resistance at $1 on July 31. However, the long wick on the day’s candlestick shows aggressive selling at higher levels. The bears will try to pull the price towards the 20-day EMA ($0.82), which is likely to act as a strong support. If MATIC bounces back from this level, it indicates that the bulls continue to buy on the dips. This could increase the probability of a break above $1. If this happens, the MATIC/USDT pair could rally to $1.26. The RSI is showing the first signs of forming a negative divergence, indicating that the bullish momentum may weaken. If the bears sink the price below the 20-day EMA, the pair could drop to $0.75. A bounce from this level could indicate that the pair could remain range-bound between $0.75 and $1 for a few days.
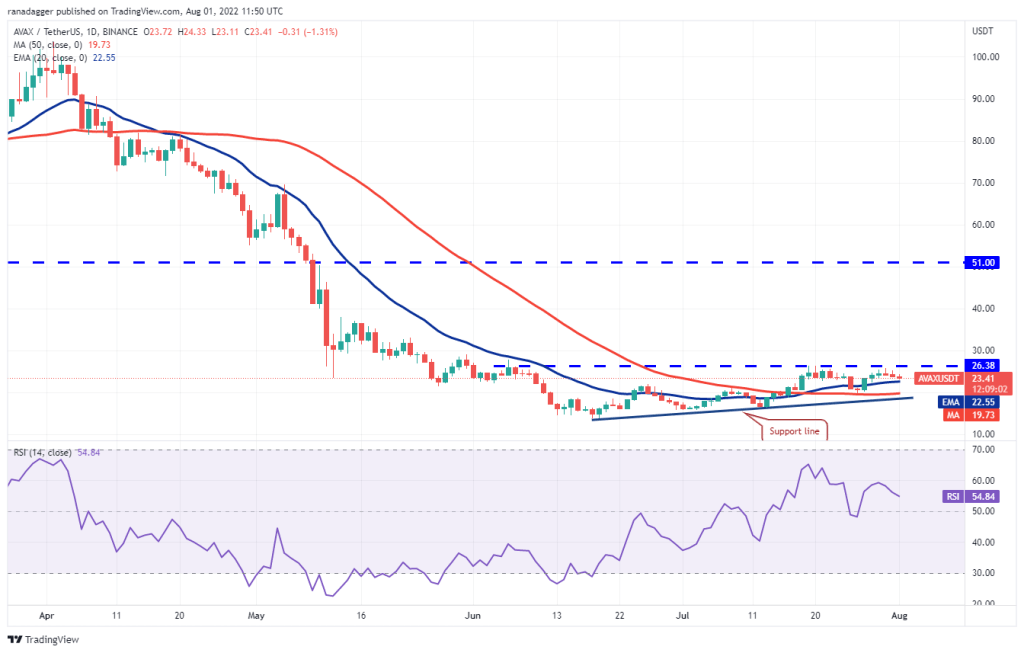
Avalanche (AVAX)
Avalanche (AVAX) bounced back from overhead resistance at $26.38 on July 30. This shows that the bears continue to defend the level vigorously. The bears will try to push the price below the 20-day EMA ($22.55). If they do, the AVAX/USDT pair will drop to the 50-day SMA ($19.73), just above the support line. A break and close below this support is possible to show that the bears are back in control. However, if the price bounces back from the moving averages, it will indicate that the bulls continue to buy on the dips. The bulls will then make another attempt to break the overhead barrier at $26.38 and start the new upward move at $33 and then $38. It should also be noted that AVAX has been following the BTC price to a large extent recently.