
Bitcoin (BTC) price approached $25,000. Interestingly, it has been consolidating in the region for a long time without seeing any corrections. Is the bear market over or is a pullback imminent?
BTC climbs to $25,000
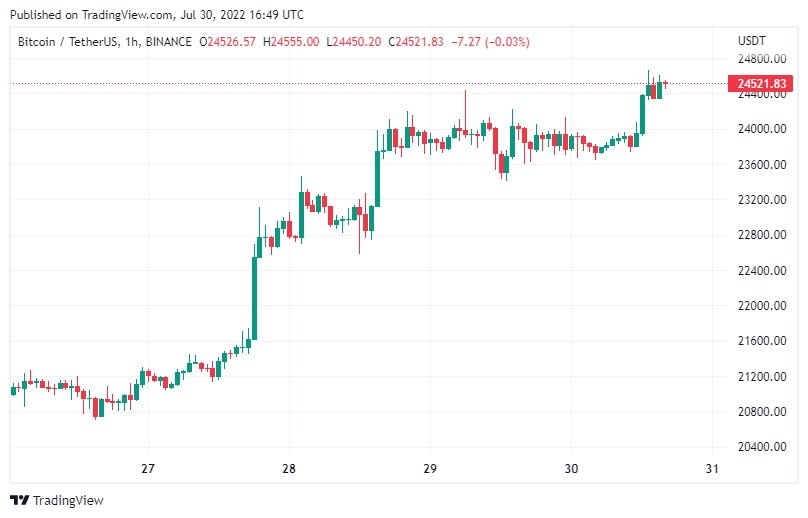
Bitcoin (BTC) hit a six-week high above $24,000 on July 29. It expanded its rally, which gained momentum after the Fed raised rates 75 basis points on July 27. If the rally continues over the next two days, Bitcoin will have a target of closing July with more than 20% gains, according to Coinglass data.
Crypto markets aren’t the only ones seeing a post-FOMC rally. US stock markets are on track for big monthly gains in July. The S&P 500 and Nasdaq Composite were up about 8.8% and 12% in July on track to record their best monthly gains since November 2020.
Crypto and equity markets rallied on expectations that the rate of Fed rate hikes will slow in the future. Arthur Hayes, former CEO of derivatives platform BitMEX, says the Fed will not raise rates any further and may eventually return to a harmonious monetary policy and more neutral rates. Can Bitcoin and altcoins prolong their recovery over the next few days? To answer, let’s take a look at the technical analysis of analyst Rakesh Upadhyay.
Bitcoin (BTC)
Bitcoin (BTC) closed below $22,213 on July 25. But the bears failed to sustain lower levels. The bulls bought the dip below $21,000 and pushed the price above the moving averages on July 27.
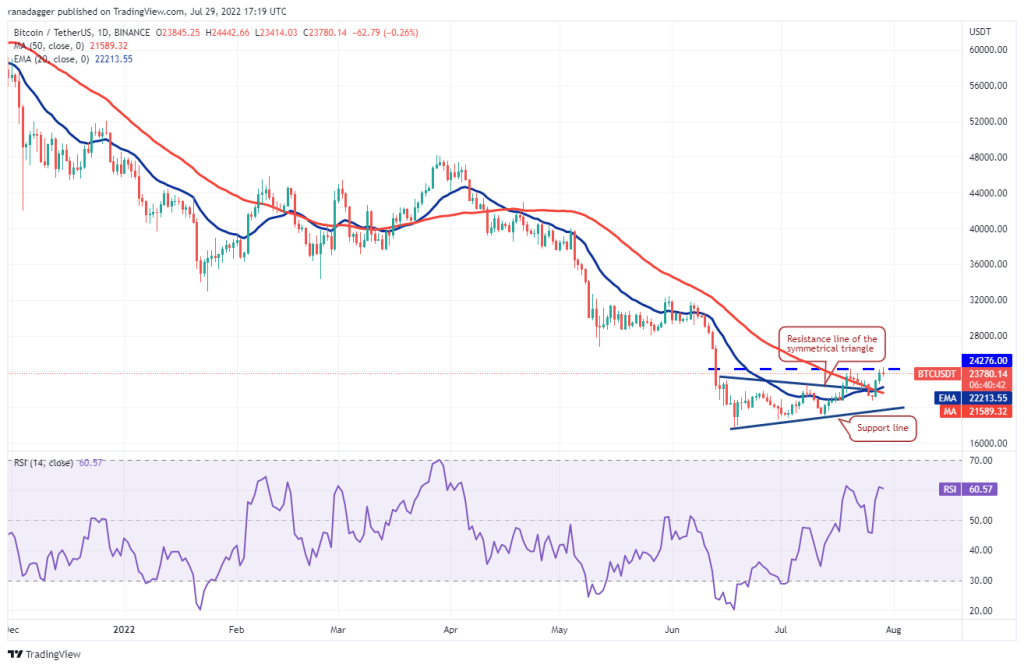
The moving averages have completed a bullish crossover and the RSI is in the positive territory. This shows that the bulls are under control. Here, the first target of the bulls will be the formation target of $28,171. If this level is crossed, the next stop is $32,000.
Alternatively, if the price declines from the current level or fails to stay above $24,276, it will indicate demand drying up at higher levels. In this case, the critical level to watch on the downside is the 20-day EMA. If this support is broken, it will mean that the bullish momentum is weakening. According to the analyst, BTC will gain momentum towards $21,589 later on.
Ethereum (ETH)
Ethereum gained sharp momentum from $1,470 on July 27. It then broke above the $1,700 critical resistance on July 28. However, the bears are not willing to give up and are trying to push the price below $1,700.
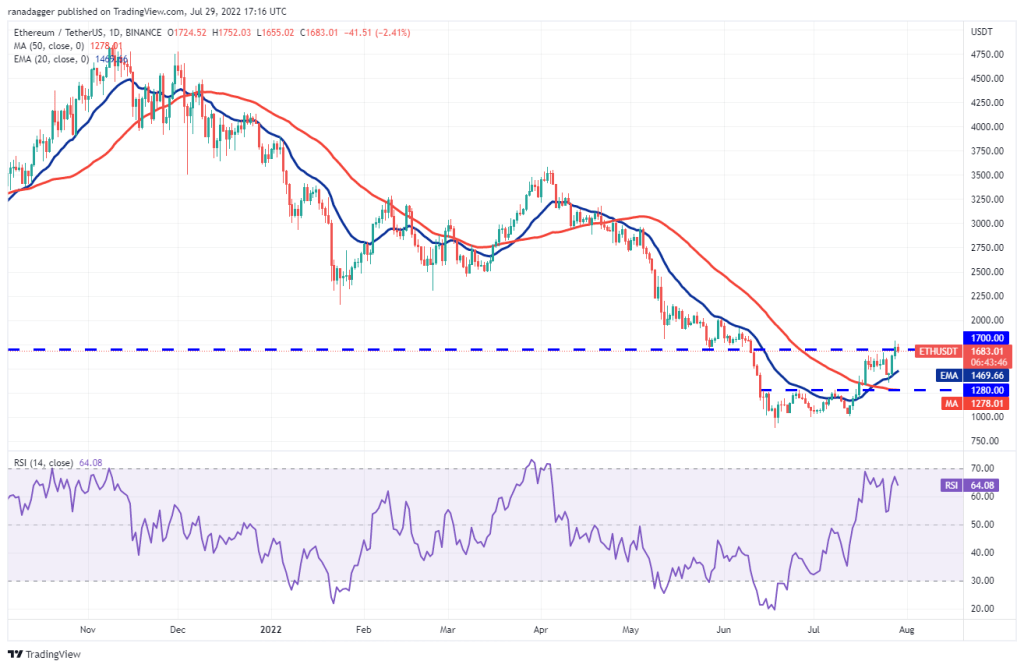
The bulls and bears are now ready for a tough battle around $1,700. However, the rising 20-day EMA and RSI in the positive zone point to an advantage for buyers. If the bulls hold the price above $1,700, it will signal increased momentum. In this case, the ETH price is targeting $2,000 and then $2,200.
Conversely, aggressive bulls will be trapped if the bears pull the price below $1,590. As a result, ETH will gain momentum towards the 20-day EMA. A strong recovery from this level will increase the likelihood of a break above $1,700. However, a break below the 20-day EMA will result in $1,280.
BNB Coin (BNB)
BNB has been trading in an ascending channel for the past few days. The price jumped from $239 on July 26. It then moved above the downtrend line, indicating a potential change in trend.
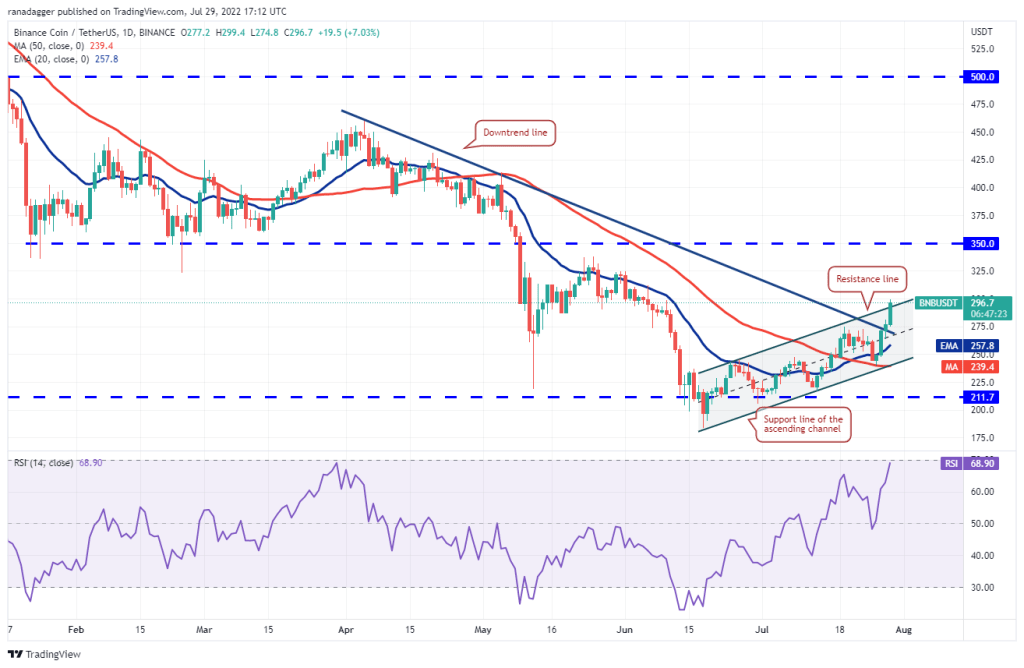
In the coming days, accompanied by bullish momentum, buyers pushed the price above the resistance line of the ascending channel. If the bulls sustain the price above the channel, BNB price will head towards the $350 resistance.
Alternatively, if the bulls fail to sustain the price above the channel, it will indicate that the bears are active at higher levels. BNB will then return to the channel and head towards the support line of the trend. A strong rebound from this level increases the likelihood of a break above the channel. The bears will have to push the price below the channel to gain the upper hand.
XRP
XRP is trading in a narrow range in the downtrend. The bears pulled the price below the moving averages on July 25. However, it failed to sustain lower levels and challenged the strong support at $0.30.
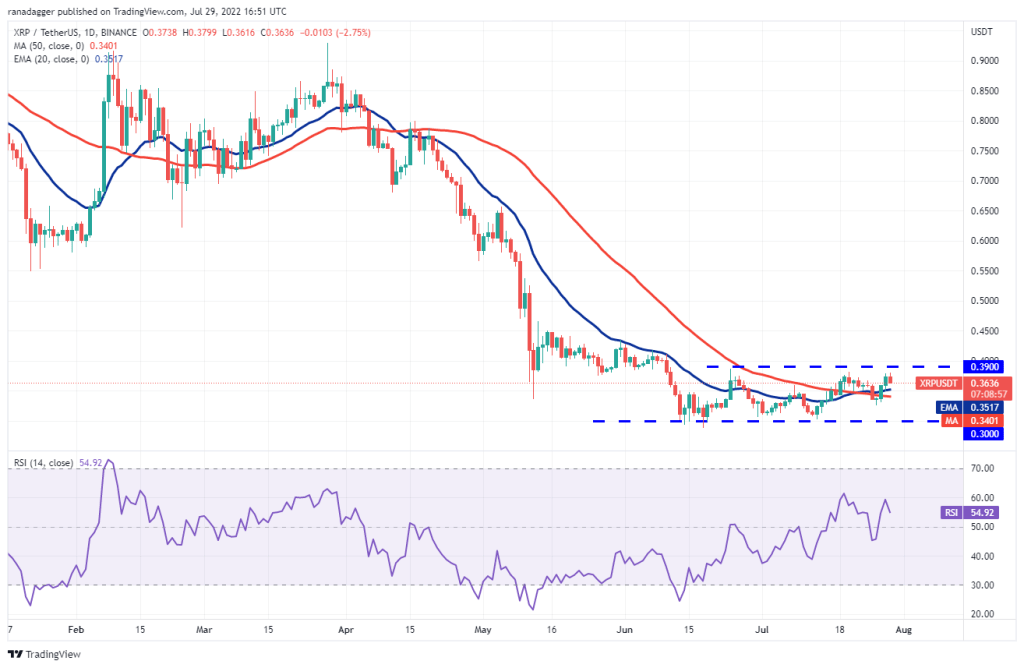
This indicates strong demand at lower levels. Buyers pushed the price above the moving averages on July 27 and are attempting to break the overhead barrier at $0.39. If they succeed, the next target will be $0.48. Contrary to this assumption, a drop from $0.39 will result in consolidation between $0.30 and $0.39 for a few more days.
Cardano (ADA)
The bulls pushed Cardano above the moving averages to reach $0.44 on July 27. The price reached the overhead resistance at $0.55, which will act as a stiff resistance.
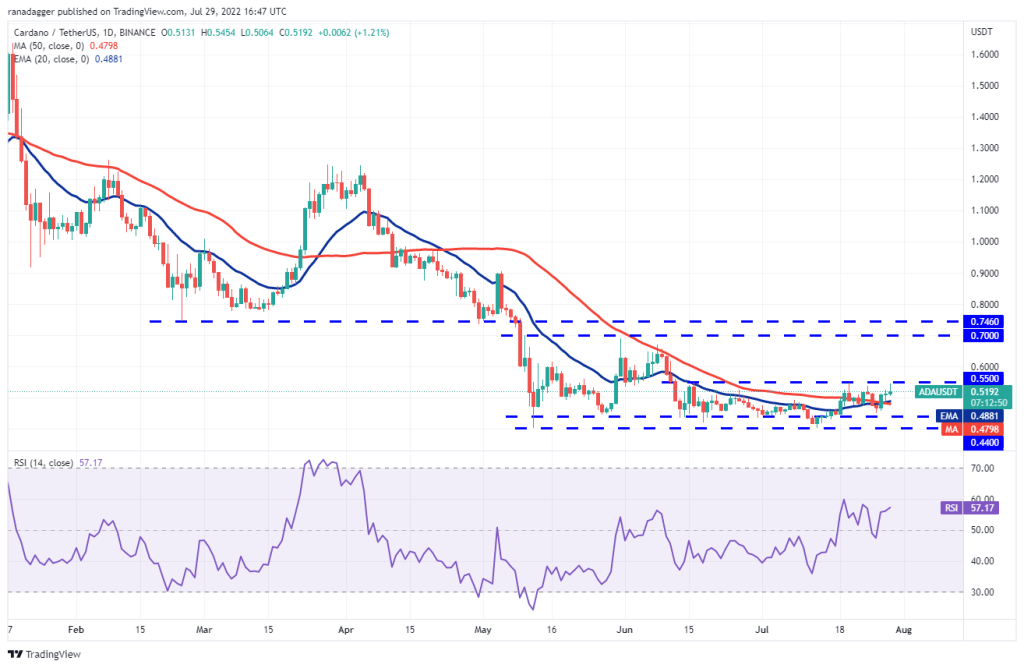
If the price drops from $0.55, the ADA price will head towards the moving averages. A break below this support suggests the $0.44 to $0.55 range. The bears need to break the $0.44 to $0.40 support zone for lower levels. However, if ADA pushes the price above $0.55, it will suggest the start of a fresh upward move. In this case, ADA’s initial targets are $0.63 and then $0.70.
Left (LEFT)
Solana (SOL) gained momentum from the support line on July 26, pointing to strong buying at the lows. The bulls then pushed the price above the moving averages on July 27.
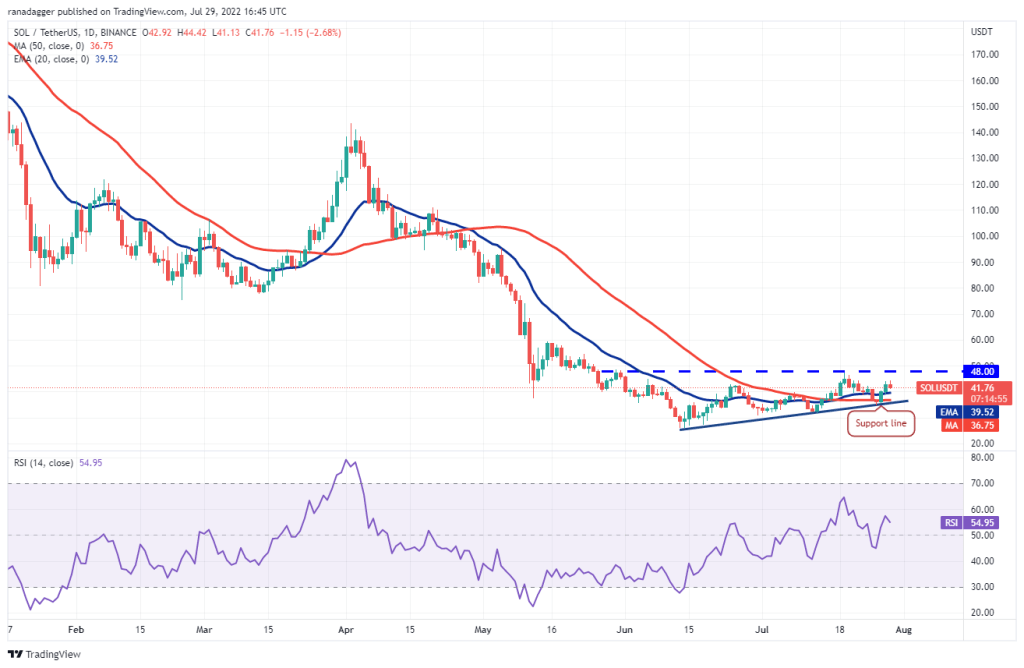
According to the analyst, the SOL price is targeting $48, which is an important level to watch out for. If the bulls break this resistance, the pair will complete the ascending triangle formation. The SOL will then head towards the formation target at $71. On the contrary, if the price drops from $48, the time inside the double triangle will extend for a few more days. A break and close below the support line turns the advantage in favor of the bears.
Dogecoin (DOGE)
Dogecoin (DOGE) bounced off the trendline of the ascending triangle formation on July 27 and broke above the moving averages. This indicates strong demand at lower levels.
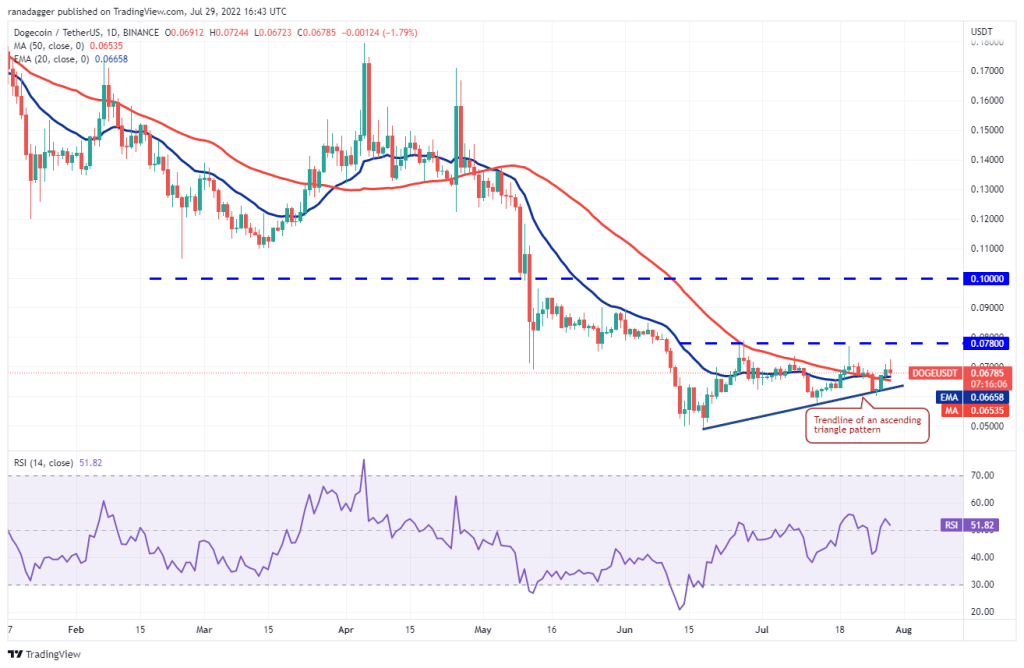
The bulls will now try to push the price towards the overhead resistance at $0.08. The moving averages have completed a bullish crossover and the RSI has bounced into the positive territory giving buyers an advantage. If the bulls push the price above $0.08, the upside will indicate that the setup is ready. According to the analyst, DOGE will then head towards the $0.11 formation target. The bears have to push the price below the trendline of the triangle to invalidate the uptrend.
Pokadot (DOT)
Polkadot (DOT) broke above the moving averages on July 27, showing that lower levels are attracting buyers. The price reached strong overhead resistance at $8.50, where the bears could form a strong defense.
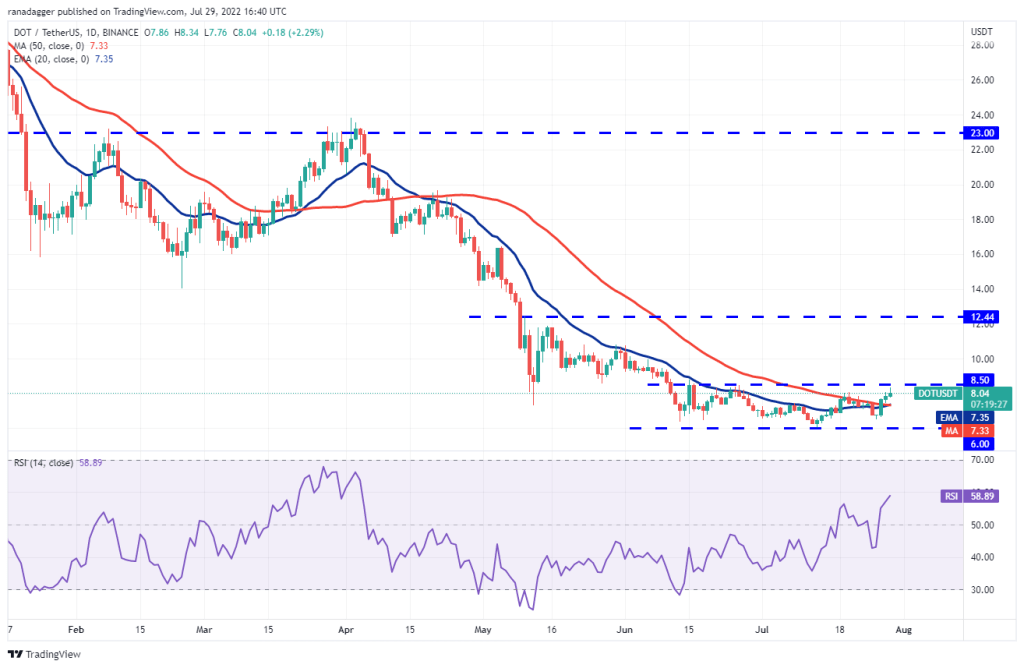
The moving averages are on the verge of a bullish crossover and the RSI is in the positive zone, suggesting that the bears may lose control. If the bulls push and sustain the price above $8.50, it will suggest the start of a fresh upward move to $10 and later to $10.80.
Contrary to this assumption, if the price drops from $8.50 and dips below the moving averages, it will suggest that the DOT price pair could oscillate within a range for a few more days. The bears need to push the pair below $6 to start the next leg of the downtrend.
Polygon (MATIC)
Polygon (MATIC) jumped at $0.79 on July 26. It broke above the downtrend line on July 27. Thus, it marked the end of the minor correction phase.
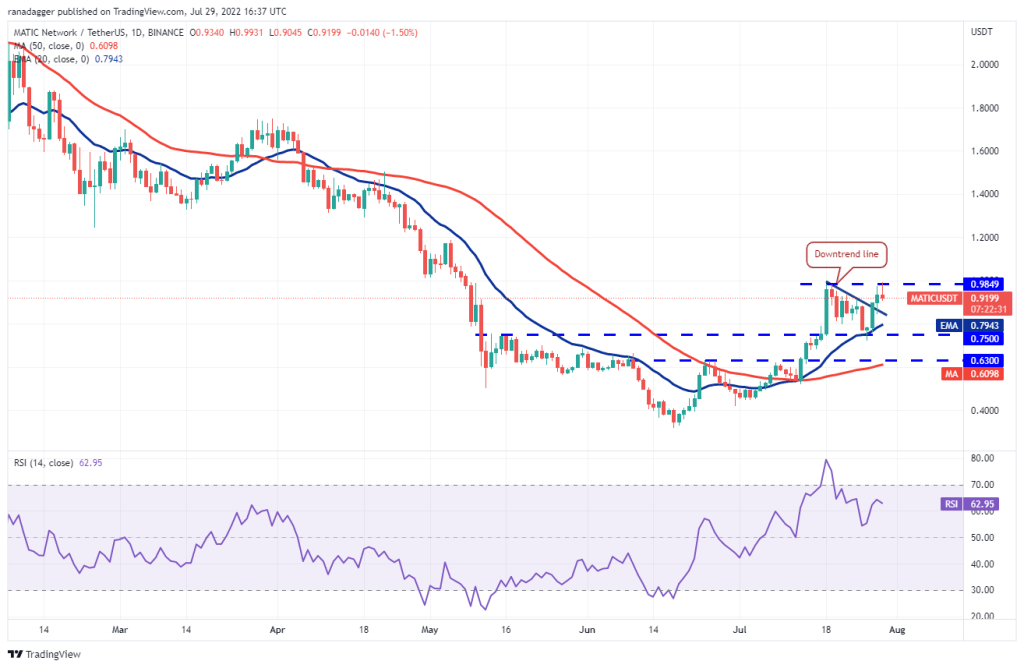
The bulls pushed the price to $0.98 on July 28 and 29. However, the long wick on the candlesticks shows that the bears are vigorously defending the level. The rising 20-day EMA and RSI in the positive zone suggest the path of least resistance is up. If the bulls push the price above the $1 psychological level, MATIC will extend its rally to $1.26. This bullish view could be invalidated in the near term if the price drops and breaks below the 20-day EMA.
Avalanche (AVAX)
cryptocoin.com As you follow, Avalanche (AVAX) gained momentum on July 26 at $19.48. It is currently approaching the overhead resistance of $26.38. The bears will try to stop the recovery at this level.
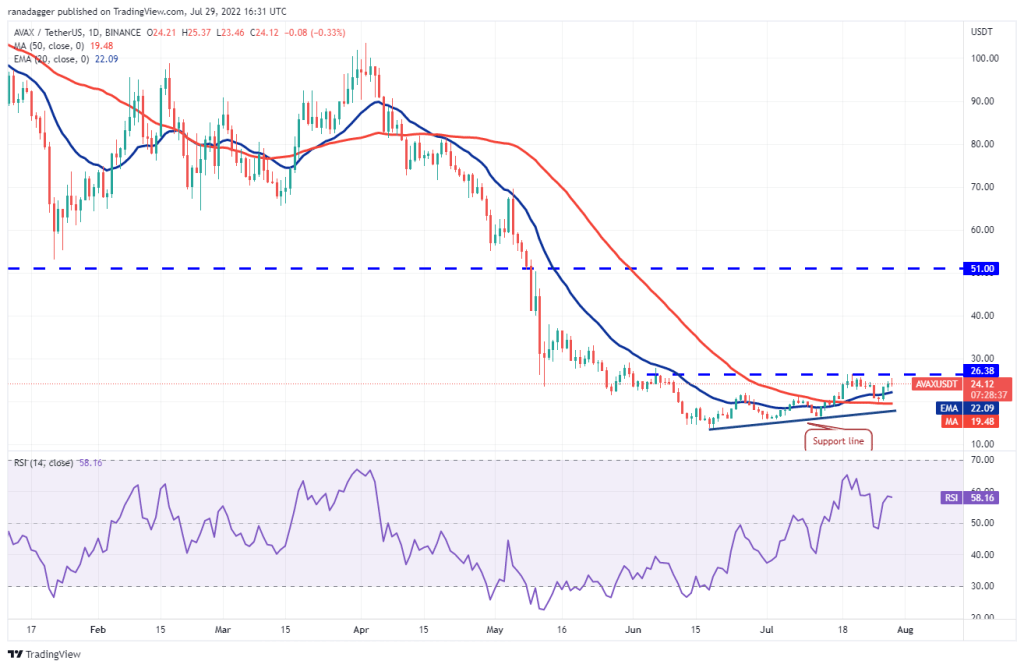
On the other hand, the slowly rising 20-day EMA ($22.10) and the RSI in the positive zone point to an advantage for buyers. If the bulls push the price above $26.38, the bullish momentum will increase. According to the analyst, AVAX will then head towards $33 and then $38.
Contrary to this assumption, if the price drops from $26.38 and breaks below the 20-day EMA, the bears will make another attempt to push the pair below the 50-day SMA and challenge the support line.