
BTC and altcoins started the week in the red, the crypto market could quickly recover if the Federal Reserve meeting aligns with the general expectations of investors. cryptocoin.comWe have compiled the buy-sell levels of these cryptocurrencies for you.
Expects large increase compared to current level
Traders tend to lighten their positions before important events because they hate uncertainty. Market watchers will watch carefully for any clues as to how high rates could rise, on February 1, when the Federal Reserve’s next policy decision is expected to raise interest rates by 25 basis points.
This could be one of the reasons for the profit reserve in Bitcoin and certain altcoins on January 30. According to some on-chain metrics, Bitcoin’s sharp recovery in January may signal the start of a new bull market. The Profit and Loss Index from on-chain analytics platform CryptoQuant has signaled its first buy since 2019.
Blockware Solutions principal analyst Joe Burnett believes that Bitcoin will not rise above its all-time high of $69,000 until the next Bitcoin halving, which is scheduled to occur in March 2024. Burnett predicts that Bitcoin’s next bull market peak will be between $150,000 and $350,000.
Trade levels for these cryptocurrencies
SPX
After several failed attempts, the S&P 500 closed above the downtrend line on January 26. However, the bears are not willing to surrender without a fight.
Sellers are attempting to stop the recovery at 4.101, but the upward sloping 20-day exponential moving average (3.972) and the relative strength index (RSI) in the positive zone suggest that the path of least resistance is on the upside. If buyers push the price above 4.101, the index could begin its journey towards 4.325.
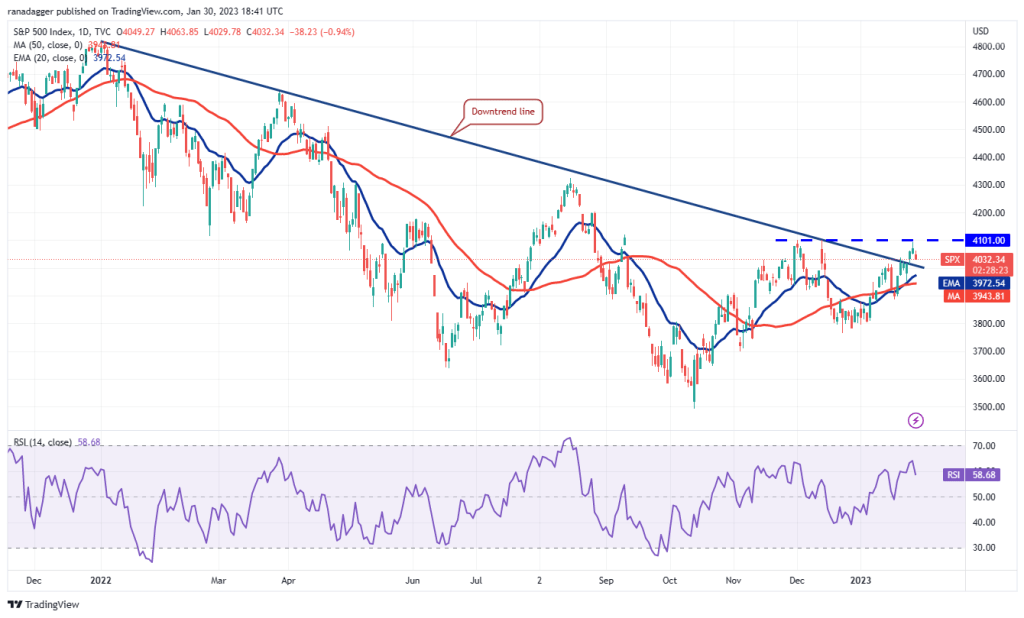
Alternatively, if the bears pull the price below the moving averages, a few aggressive bulls could fall into the trap and then the index could drop to 3,764.
DXY
The US Dollar Index (DXY) is falling inside a descending widening wedge pattern but the bulls are trying to protect the support at 101.29.
The uptrend could face selling at the 20-day EMA (102.63) because bears defended this level during downtrends. If the price turns down from the 20-day EMA, the probability of a break below 101.29 increases. This could push the index down to the psychologically very important 100 level.
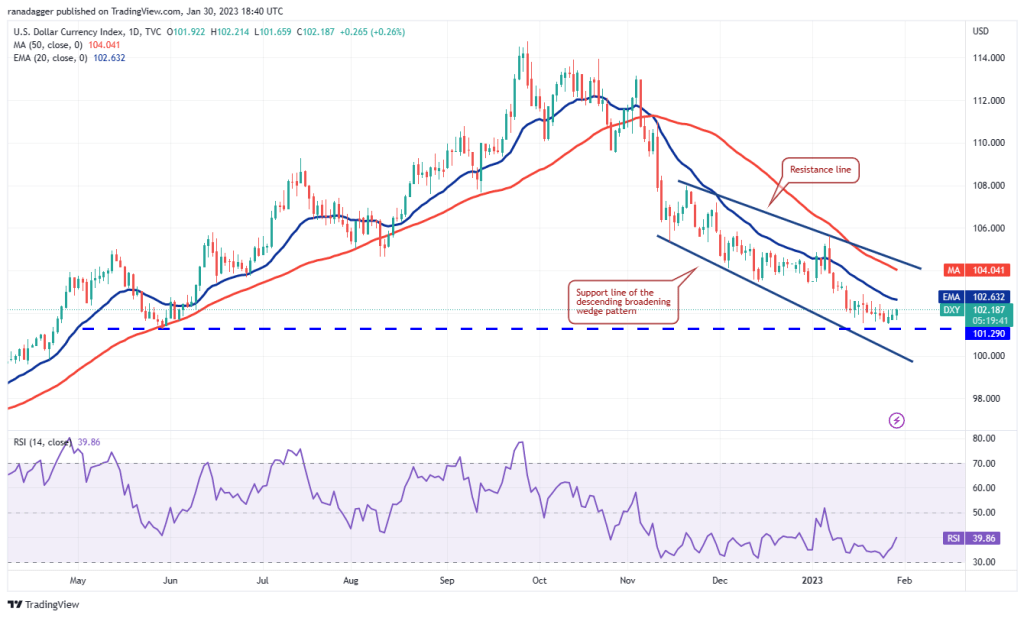
On the contrary, if the index rises above the 20-day EMA, it will indicate strong demand from the bulls. The index can then rise towards the wedge’s resistance line. The bulls will need to break through this hurdle to suggest that the short-term downtrend may be over.
BTC/USDT
Bitcoin climbed above the $23,816 resistance on January 29, but the bulls failed to rise above the momentum on January 30. This may have encouraged short-term traders to take profits and the BTC price dropped to $22,800.
If the price recovers from $22,800, it will show that the bulls have turned the level to support. This could raise the probability of a rally to $25,211. Sellers will probably hold this level with all their might because if $25,211 is conquered, the BTC/USDT pair could skyrocket towards the $30,000 to $32,000 region.
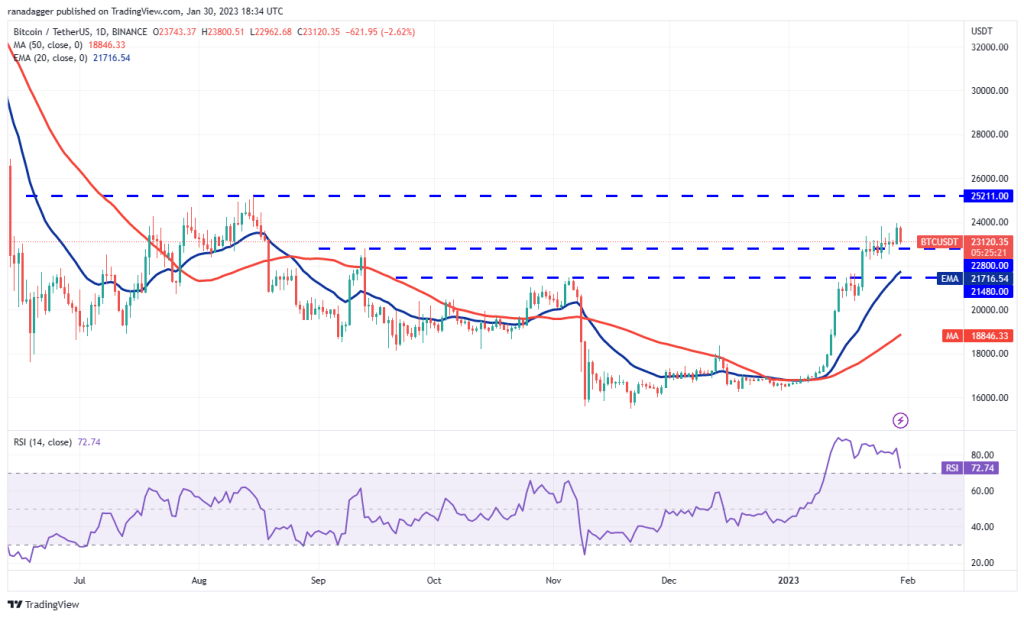
On the other hand, if the bears pull BTC price below $22,800, the correction could deepen to the 20-day EMA ($21,716) and then BTC to the psychological support at $20,000.
ETH/USDT
Ether once again reached near the overhead resistance of $1,680 but the bulls failed to break through. This means that the price is stuck between the 20-day EMA ($1,540) and $1,680.
If the price bounces back from the 20-day EMA, it will suggest strong buying on the dips. The bulls will then attempt to push the price back above $1,680. If they are successful, the ETH/USDT pair may pause briefly near $1,800 and rise to $2,000.
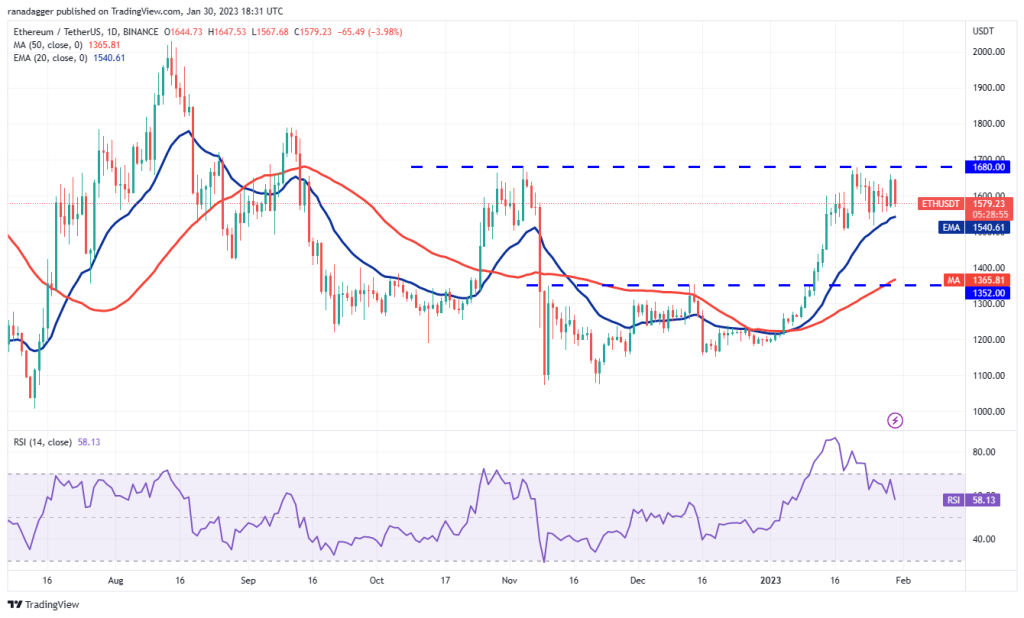
Contrary to this assumption, if the price drops and falls below the 20-day EMA, it could attract profit booking by short-term bulls. The pair could then drop to the 50-day SMA ($1,365), which could act as a strong support.
BNB/USDT
BNB touched the strong resistance at $318 on Jan 29 but the bulls failed to break through. This indicates that the bears are fiercely defending the level.
The immediate support to the downside is the 20-day EMA ($298). While the ascending 20-day EMA has the advantage for buyers, the negative divergence in the RSI indicates that the positive momentum may be weakening. Selling could accelerate with a break below the 20-day EMA and the BNB/USDT pair could drop to $280.
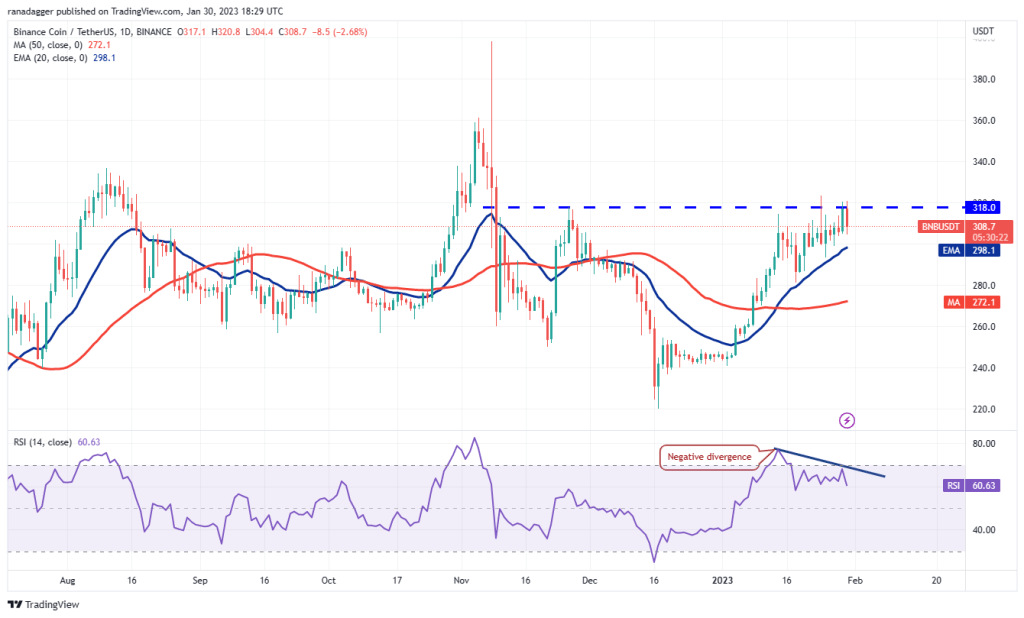
Conversely, if the price rises from the 20-day EMA, the bulls will attempt to push the pair back above $318. If they manage to do so, the pair could rally to $360.
XRP/USDT
XRP price is stuck between the 20-day EMA ($0.40) and the overhead resistance at $0.42. Usually, a tight consolidation near the overhead resistance gives buyers an advantage, but some traders may take profits when the bulls fail to break through the hurdle even after repeated attempts.
This could initiate a deeper correction, in which case a break below the 20-day EMA could open the doors for a drop to the 50-day SMA ($0.37).
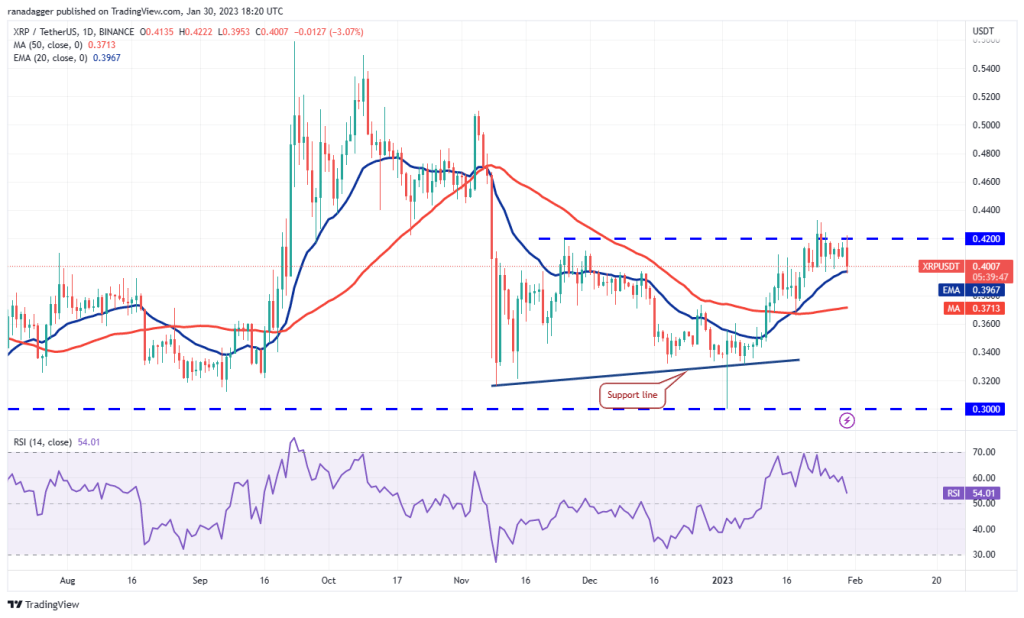
If the bulls want to continue their dominance, they will have to quickly push the XRP/USDT pair above the $0.42 to $0.44 resistance zone. This could start a rally to $0.51.
DOGE/USDT
The bears are not allowing Dogecoin to stay above $0.09 and the bulls are not allowing it to fall below the 20-day EMA ($0.08).
If the price rebounds from the current level, the bulls will again try to push the DOGE/USDT pair above $0.09. If they manage to do so, the pair could rally to $0.11 where the bears could once again establish a strong defense.
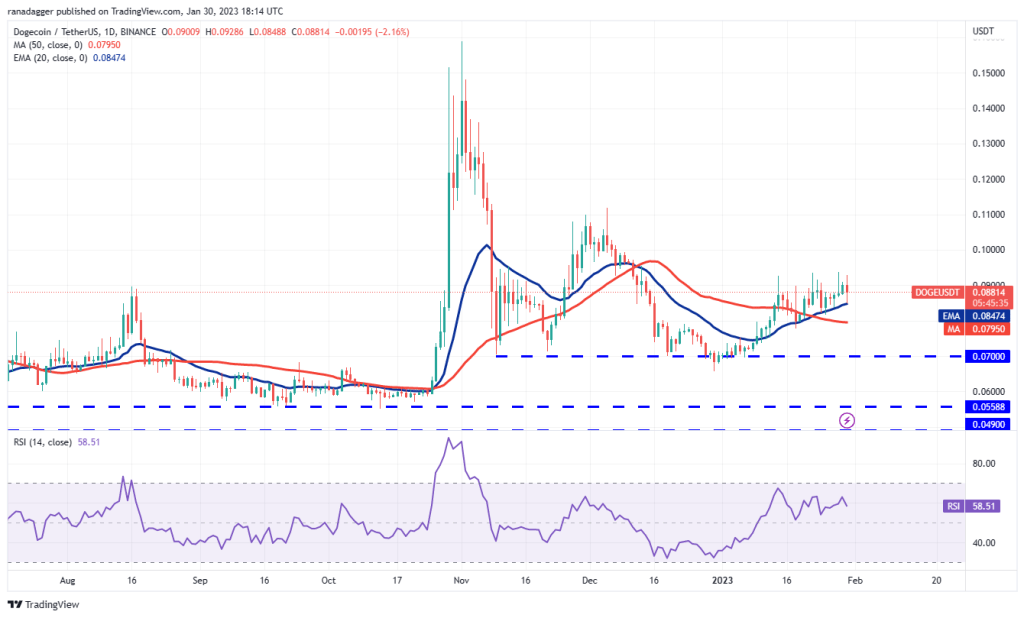
Conversely, if the price breaks below the 20-day EMA, the next stop could be the 50-day SMA ($0.08). This level could act as a minor support, but if the bears push the price below it, the pair could drop to the critical support near $0.07.
ADA/USDT
Trading above the $0.38 resistance for three days, Cardano dropped below the breakout level on Jan. 30. This indicates that the bears are active at higher levels.
The rising 20-day EMA ($0.36) points to the advantage for buyers, but the negative divergence in the RSI warns that the bulls may be losing their grip. The bears will try to pull the price towards the 20-day EMA, which is an important level to watch in the near term.
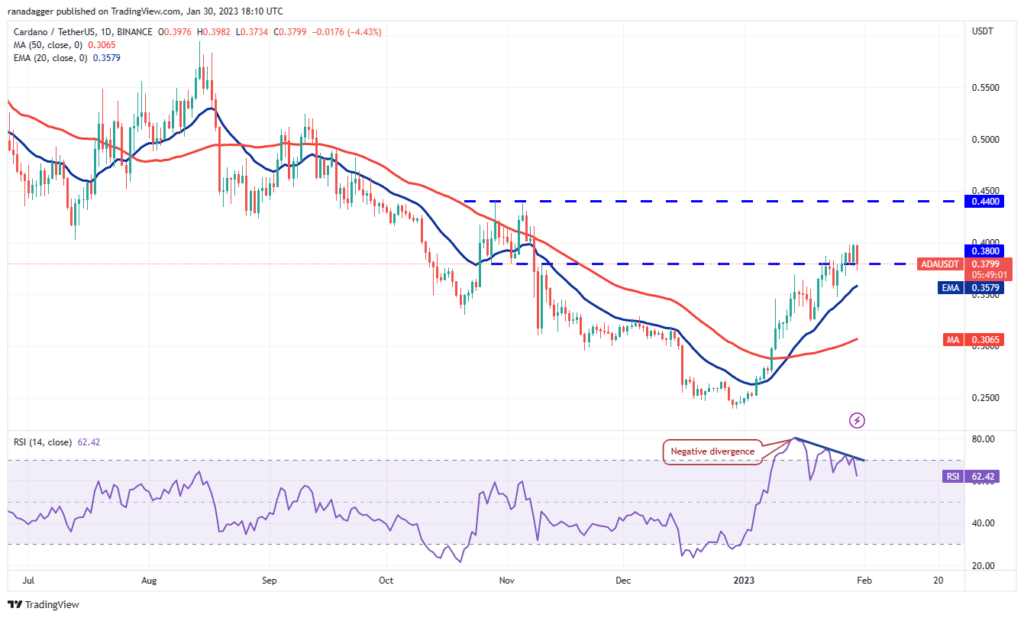
If the price breaks below the 20-day EMA, selling could increase and the ADA/USDT pair could drop to $0.32. On the contrary, if buyers want to maintain their dominance, they will have to quickly push the price above $0.40. The pair could then go to $0.44.
MATIC/USDT
Polygon’s rise met heavy selling around $1.20 on Jan. 29. The price could retest the $1.05 breakout, which is an important level to watch.
If the price bounces back from $1.05, it will show that the bulls have turned the level to support. Buyers will then try to push the price above $1.20 and challenge the strong resistance near $1.30.
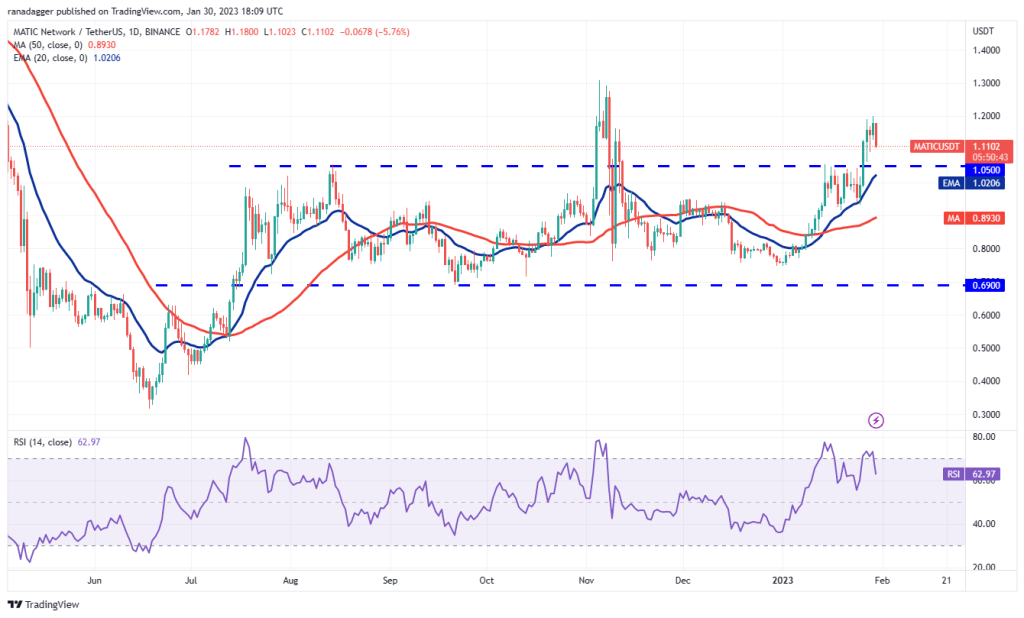
On the other hand, if the price dips below the 20-day EMA ($1.02), it will indicate that a break above $1.05 could be a bull trap. The MATIC/USDT pair could then drop to the 50-day SMA ($0.89).
DOT/USDT
Polkadot’s struggle to hold above the resistance line for the past few days shows that the bears are fiercely defending this level.
Sellers will try to push the price below the 20-day EMA ($6). If they do, it could turn the short-term advantage in favor of the bears. The DOT/USDT pair could then drop to $5.50 and then to the 50-day SMA ($5.20).
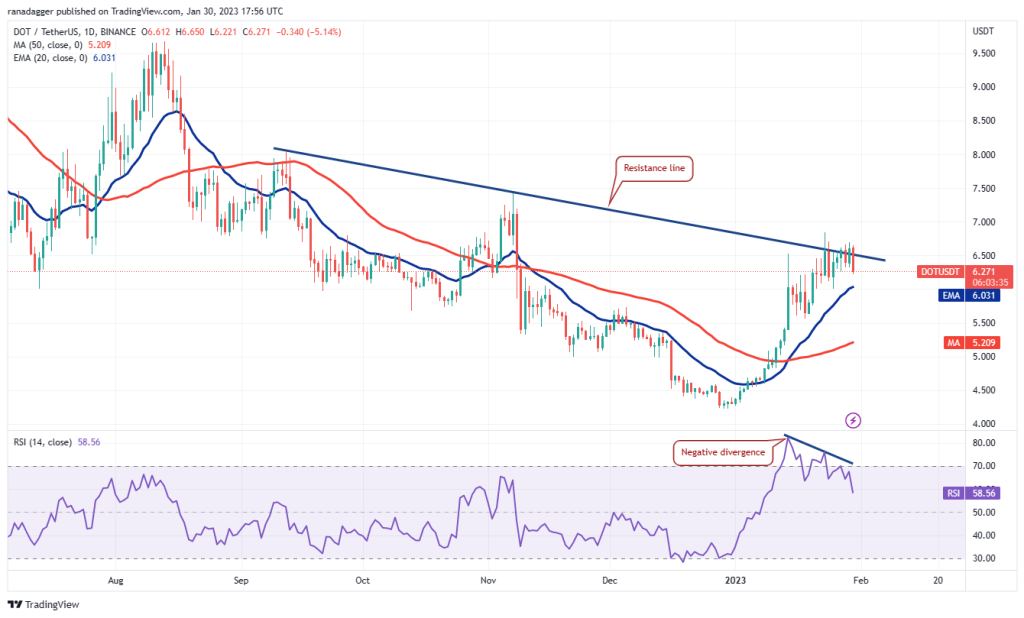
Conversely, if the price bounces off the 20-day EMA, the bulls will attempt to clear the general zone between the resistance line and $6.84. If this happens, the pair could rally towards $8. There is a minor support at $7.42 but it is likely to be surpassed.