According to analyst Avi Felman, SushiSwap (SUSHI) does not seem fragile. Crypto analyst Kelvin Munene assesses the bull run of Cosmos (ATOM). Santiment made a post about the price performance of Cardano (ADA) in 2023. Reporting shocking returns since the local bottom, will Fetch.AI (FET) make its way? We have compiled the forecasts and comments of analysts on altcoin projects for our readers.
“SushiSwap (SUSHI) can be revived”
Analyst and trader Avi Felman, head of the heavily invested digital assets trading arm at GoldenTree Asset Management, explained why SushiSwap (SUSHI) is so enthusiastic about its macro prospects. Felman shared a thread about the prospects for the ‘blue chips’ of the DeFi segment, specifically SushiSwap (SUSHI) in 2023. The analyst acknowledged that in the 3rd and 4th quarters of 2022, the prices, sentiment and usage of altcoin projects fell to lows not seen since the 218 crypto winter.
1/ ON SUSHI: The latter half of 2022 proved to be a challenging time for everyone in the markets (both crypto and tradfi). Prices, usage and sentiment in the crypto markets all reached lows that I personally haven’t seen since 2018.
— Avi (@AviFelman) February 3, 2023
Meanwhile, a series of failures of centralized services has demonstrated the necessity of all-on-chain protocols. SushiSwap (SUSHI), one of the most overrated ‘yield aggregation’ platforms of the 2020 DeFi Summer, is a textbook example of the promises and challenges of on-chain ‘ultimate’ governance. So it doesn’t look fragile to the analyst.
Moreover, many modules of SushiSwap have been renewed to meet the upcoming bullish rally. For example, he launched Sushi Academy, a Web3 knowledge codebase for all. It educates crypto newcomers on both basic Web3 issues and SushiSwap’s services. Next, SushiSwap meets 2023 with an upgraded user interface and enhanced trading toolset. New opportunities are unlocked for both passive liquidity providers and traders. Also, SushiSwap became one of the first ‘legacy’ DeFi to introduce native NFT trading functionality.
ATOM indicators point to bull run
Crypto analyst Kelvin Munene examines the technical indicators of Cosmos (ATOM). The ATOM market corrected in the last hours and the price was up 1.62% to $15.05. This bullish dominance pushed ATOM to a 30-day high of $15.12 after reaching support around $14.31.
Market cap rose 1.61% to $4,308,719,475 due to the bullish action. However, 24-hour trading volume was down 49.58% to $253,741,041. The current gain is linked to positive investor sentiment and increased demand for ATOM. However, as the 24-hour trading volume is on the decline, it is not yet clear whether the uptrend will continue for longer.
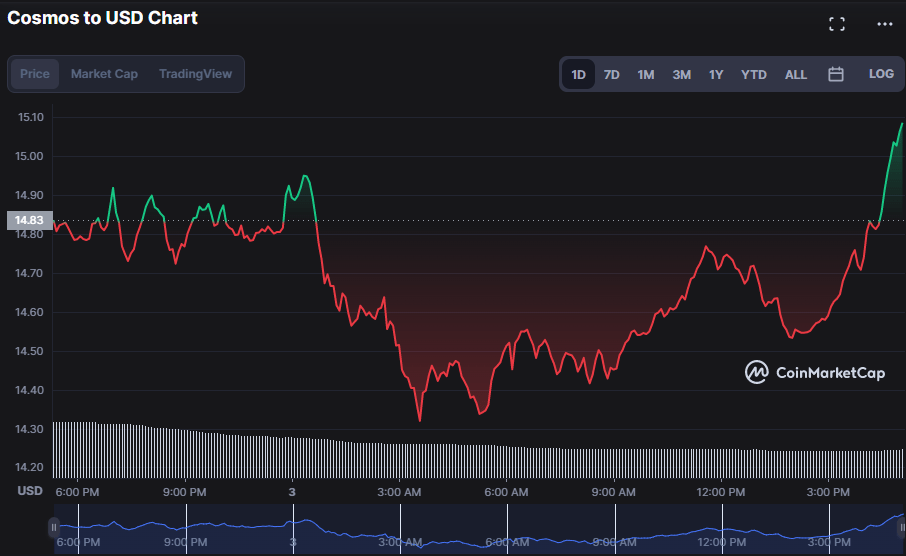 ATOM 24-hour price chart / Source: CoinMarketCap
The McGinley dynamic indicator line on the ATOM 4-hours price chart is heading north at 14.040, indicating that buyers have the upper hand in price action and the optimism will continue. The Fisher Transform hovered above the signal line with a value of 0.71, confirming the positive momentum on the altcoin chart. Also, the Relative Strength Index (RSI) is currently at 67.69, just below the overbought level of 70.
This indicates that the market may still have some upside potential before being declared overbought. This move indicates that the positive trend may continue in the short term as the market is rapidly approaching overbought levels.
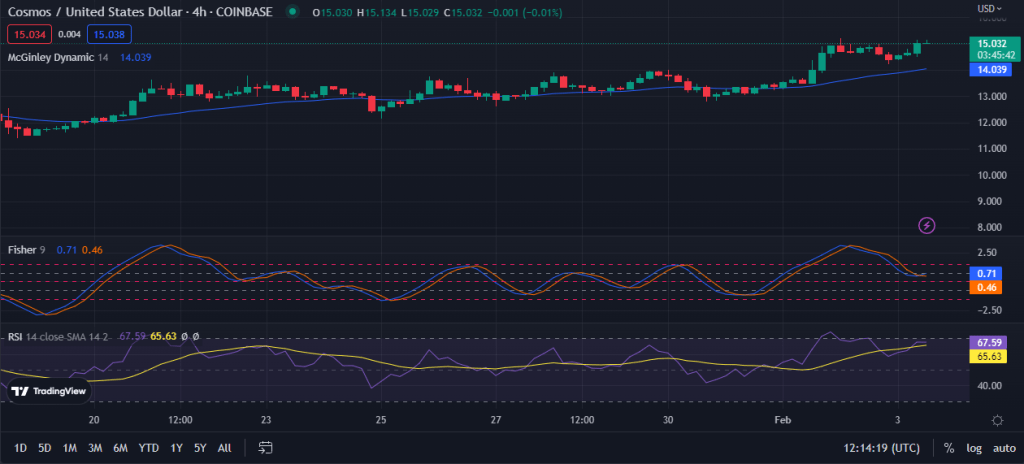 ATOM 4-hour price chart / Source: TradingView
Bollinger bands widen with the upper band at $15,541 and the lower band at $12,944, showing more volatility in the ATOM market. As the price approaches the upper range, a break above $15,541 will signal a significant rise in volatility and definitely a continuation of the bullish trend. ATOM traders should be prepared for more volatile market conditions in light of this potential price jump.
BBP’s positive trend of 0.988 indicates that buyers are regaining control of the market. This is a sign that the altcoin price will soon start a significant rise. Additionally, the fact that it is trending north means there are a lot of bulls in the market and the price could soon rise above the $15,541 resistance.
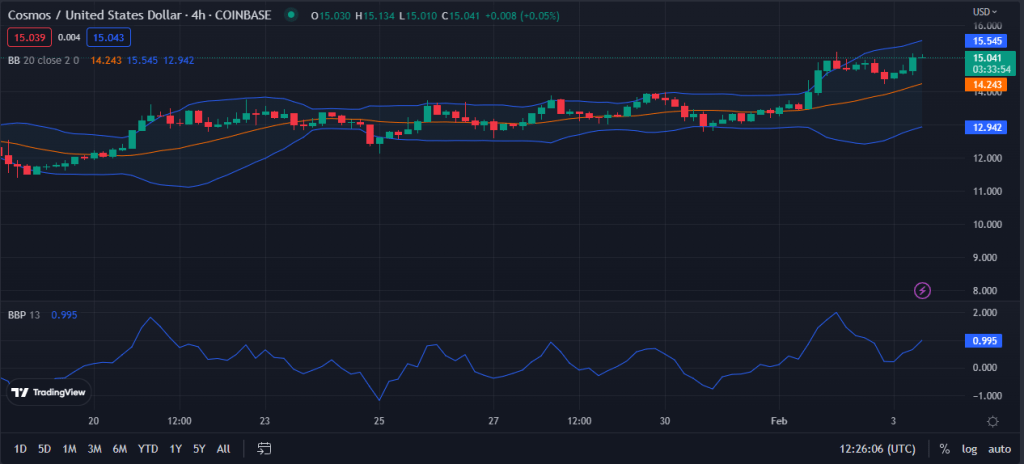 ATOM 4-hour price chart / Source: TradingView
Cosmos bulls need to break through and stay above the current resistance level to maintain dominance.
Altcoin price rises 65% in 2023 as whales accumulate
Blockchain intelligence firm Santiment tweeted today about Cardano’s price performance in 2023. According to the tweet, the price of Cardano (ADA) has increased by 65% in 2023. The intelligence firm attributes this impressive gain to the massive accumulation by whale addresses of the altcoin project.
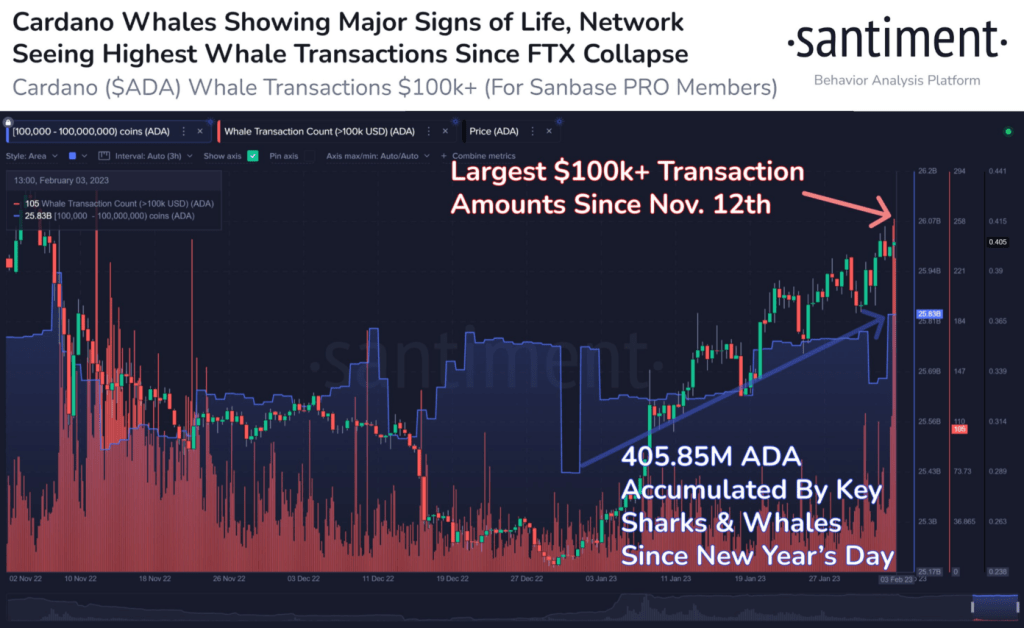 ADA whale accumulation / Source: Santiment
The post states that ADA addresses holding between 100,000 and 100 million ADA have held the most money in their combined wallets since November 8, 2023. However, the price of ADA has dropped in the last 24 hours, according to CoinMarketCap. At press time, ADA is trading at around $0.3999 after a price drop of 0.34% over the past 24 hours. Despite this, ADA’s weekly price performance remains in the green at 2.16%.
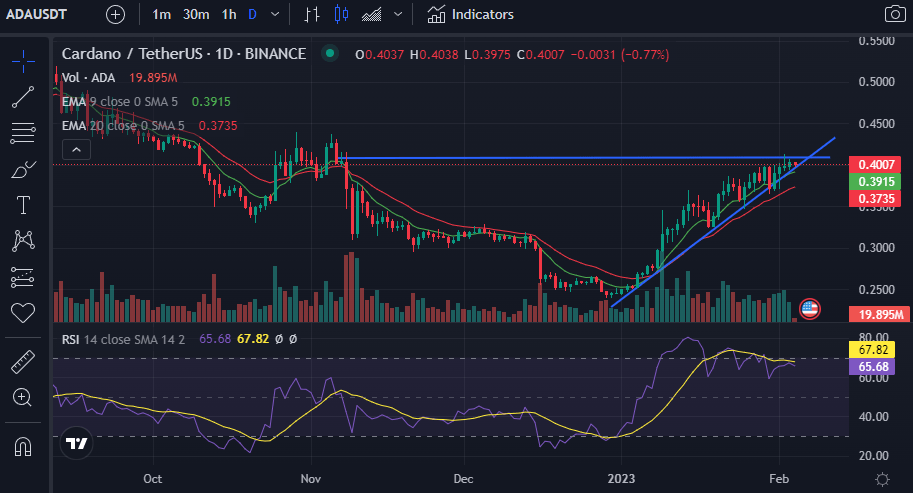 Daily chart for ADA / Source: CoinMarketCap
Crypto analyst Steven Walgenbach cites the following regarding ADA’s technical outlook. ADA price is approaching a key $0.4071 resistance level. It attempted to break above this level on February 2, 2023 and the daily high was set at $0.4136. This move was short-lived, however, as the altcoin price closed the day’s trading session at $0.3981.
The current momentum of ADA supports the bulls as the 9-day EMA line is positioned above the 20-day EMA. The daily RSI indicator shows that this momentum will end soon, as the daily RSI line is sloping negatively towards the oversold zone. In addition, the daily RSI line is positioned below the daily RSI SMA line after the daily RSI line crossed over the SMA line and failed to signal a bullish flag.
This altcoin explodes as the AI arms race accelerates
cryptocoin.com As you follow, the undeniable potential of OpenAI’s ChatGPT has sparked intense interest in artificial intelligence. It has also helped drive AI-related cryptocurrencies to significantly higher prices. The New York Times says the program has spawned an ‘arms race’ in AI, with the entire tech world rushing to harness its power at the same time, otherwise risking being completely disrupted.
Reports circulated yesterday that the now famous AI chatbot has surpassed 100 million monthly active users in just two months since its launch. For comparison, UBS analysts say that Instagram took 30 months to achieve the same success, while TikTok took nine months.
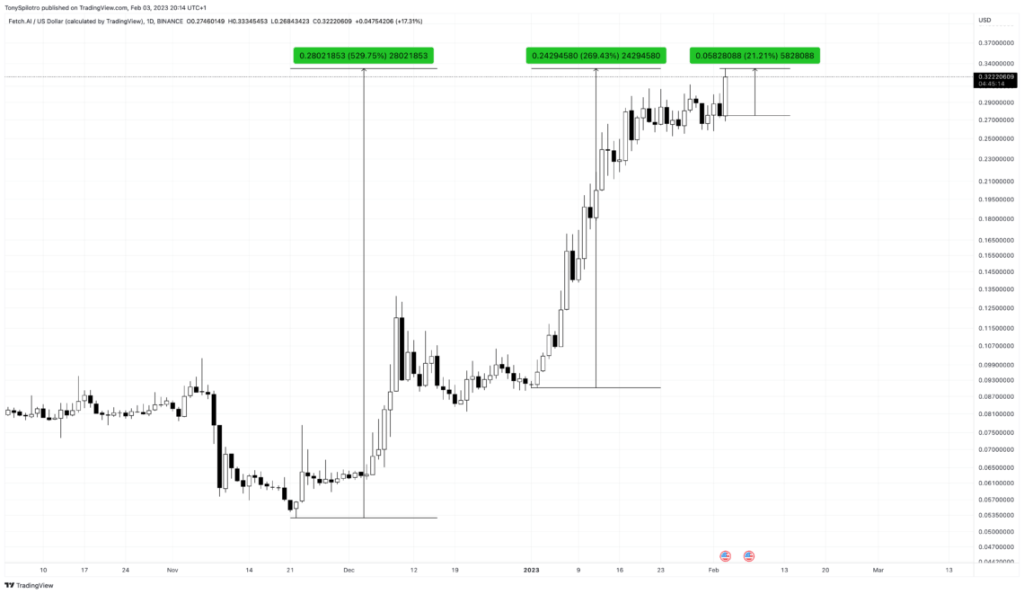 FET had a massive rally / Source: TradingView
Fetch.AI has no affiliation with OpenAI or ChatGPT. But it took advantage of the larger categorical trend. It is currently the 139th cryptocurrency by market cap. Also, it is currently moving forward in the green zone. Meanwhile, FET rallied 269% year-to-date, rebounding 529% from lows set at the end of November. Despite all these positive developments, Fetch.AI remained 73% below its all-time high in 2021. Old highs above $1.26 are roughly 269% higher from here.
Will altcoin continue its rally?
Fetch.AI has reported shocking returns to start the year and since the local bottom. It continues to outperform other AI tokens in the broader crypto market. But after a sudden rally, could the AI-connected cryptocurrency be ready for a pullback? Crypto analyst Tony Spilotro shares the following analysis.
In a bullish scenario, FET is breaking out monthly at the midline of the Bollinger Bands, the 20-month simple moving average, and running for the upper band located near the old highs. In the bear scenario, the FET is rejected at the resistor. The rally could also slow down and the price could consolidate below the median with a more neutral outcome.
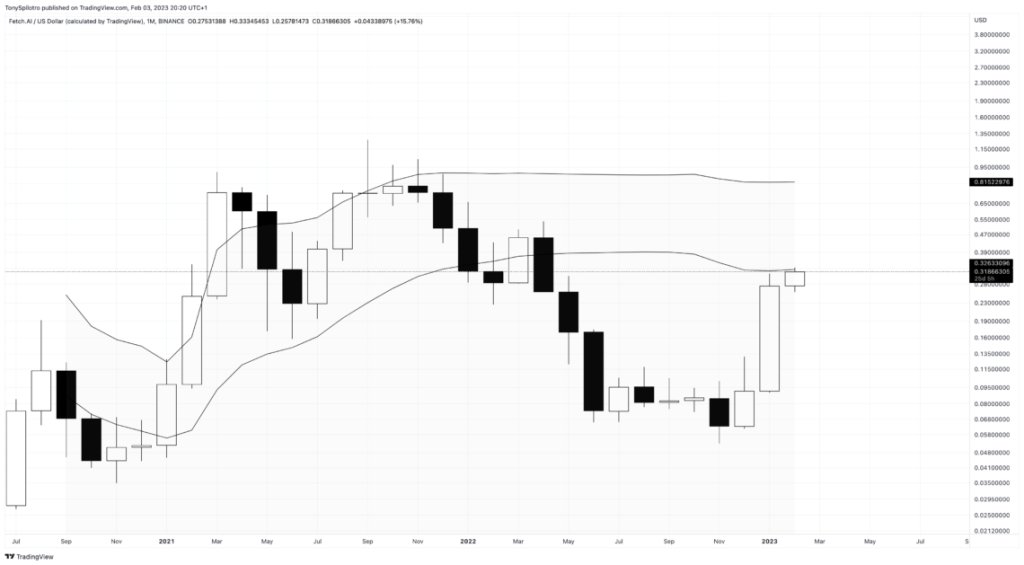 FET reached monthly resistance by Bollinger Bands / TradingView
The inflection point in the FET can also be seen on the weekly timeframe, which triggered a TD9 sell setup perfected using the TD Sequential. The setup looks just below the TDST resistor (red line shown below). A failed sell signal is a strong buy signal, although the signal supports FET selling after a long rally. Note the previous three instances where FET weekly charts resulted in an excellent selling pattern. Two-thirds barely led to a pullback and FET continued to climb, while the third resulted in a longer-term peak and a brutal 95% collapse from peak-to-bottom.
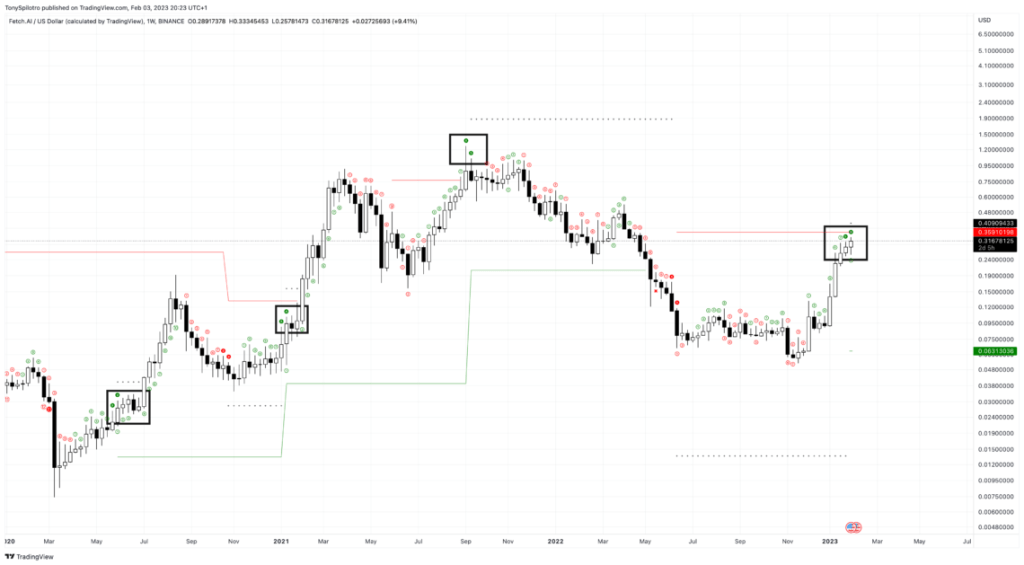 Will the AI trend cool or continue to warm? / TradingView
