Sales in Bitcoin (BTC) show no signs of waning and Bitcoin has fallen for the first time in seven consecutive weeks. This indicates that the momentum remains strongly in favor of the bears. While short-term sentiment remains bearish, institutional investors seem to be taking a longer-term approach to cryptocurrencies.
Bitcoin and major altcoins may rally relief
After the turmoil and volatility of the past week, crypto prices may attempt a relief rally in the next few days. A V-shaped recovery is unlikely as macro conditions are not supportive. In times of high volatility and uncertainty, it may be a wise decision to reduce the size of the trading position to keep risk in check.

So what are the critical support and resistance levels for major cryptocurrencies that could signal a potential change? As Kriptokoin.com, we provide analyst views, price analyzes and critical levels for DOGE, Bitcoin and these 8 altcoins.
Bitcoin (BTC) and Ethereum (ETH)
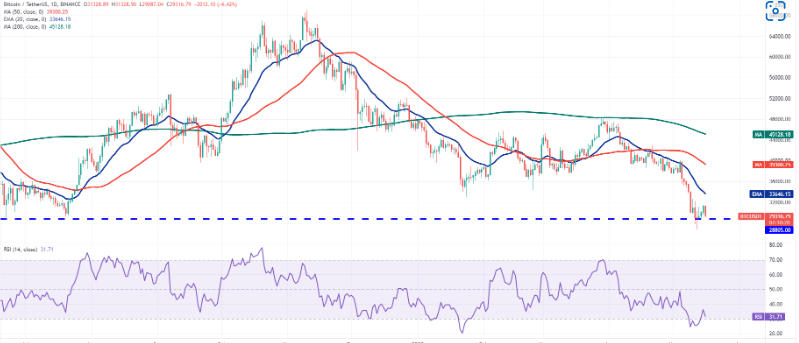
Bitcoin bounced back at $3,460, suggesting that the bears were selling on small rallies. The bears will now attempt to push the price below the critical support at $28,805, but the bulls are likely to have other plans. If the price rebounds from $28,805, the bulls will try to push the BTC/USDT pair to the 20-day exponential moving average (EMA) ($33,646). This is an important level to consider, as a break and close above it could indicate that the bulls are trying to bounce back. The pair could then rise to the 50-day simple moving average (SMA) ($39,300). Contrary to this assumption, if the price dips below $28,805, the pair could drop to $26,700. If this support is broken, the pair could resume its downtrend and the price could drop to $25,000 and later to $21,800.
Ethereum (ETH), on the other hand, is facing stiff resistance at the $2,159 breakout level, suggesting that the bears continue to be sold on rallies. The bears will now try to push the price below the critical support at $1,940. If successful, the ETH/USDT pair could drop to the critical support at $1,700. This is an important level for the bulls to defend because if they fail to do so, the downtrend could continue and the pair could drop to $1,500. Contrary to this assumption, if the price rises from $1,700, the pair could rally to $2,159 and stay in the range between these two levels. The first sign of strength will be a break and a close above $2,159. This could open the way for a rally to the 20-day EMA ($2,421). The bulls will have to break through this hurdle to show that the downtrend may be coming to an end.
BNB and Ripple (XRP)
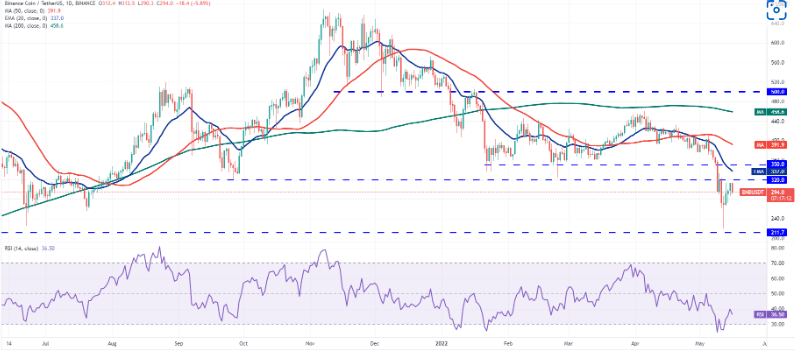
BNB’s strong recovery approached the breakout level of $320 on May 13 and 15 but the bulls failed to clear this level. This shows that the bears are trying to turn the level into resistance. The BNB/USDT pair could now decline to $265, which is likely to act as support. If the price bounces back from this level, buyers will try to push the pair back above $320. If they are successful, the pair could rally to $350 and then to the 50-day SMA ($391). Alternatively, if the price dips below $265, the pair could decline towards the strong support at $211. The bulls are expected to defend this level strongly. A strong bounce from this support could hold the pair between $211 and $320 for the next few days.
Looking at Ripple, the long wick on the May 13 candlestick indicates that the bears are attempting to form a strong challenge near the $0.50 breakout level. Failure to break above this general resistance could encourage short-term investors to take profits. If the price continues to drop below $0.38, the XRP/USDT pair could drop to $0.33. The bulls are expected to defend this level aggressively, but if the support is broken, the bearish momentum could increase and the pair could drop to $0.24. Contrary to this assumption, if the price bounces off the current level or support at $0.38, the bulls will try to push the pair above the $0.50 to $0.55 zone. If they are successful, it will indicate that the markets are rejecting the lower levels. This could clear the way for a potential rally to the 50-day SMA ($0.67).
Cardano (ADA) and Solana (SOL)
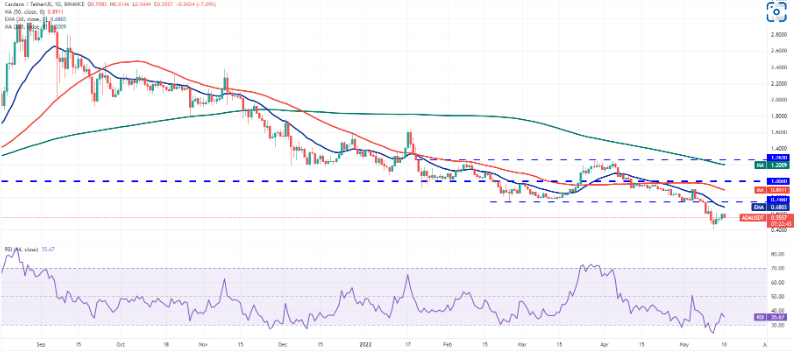
Cardano’s relief rally faces sell-off at $0.61 showing the bears are not willing to give up their advantage. The bears will attempt to push the price below $0.46 and retest the intraday low of May 12 at $0.40. If the price dips below $0.40, the sell-off could intensify further and the ADA/USDT pair could drop to $0.33 and later to $0.28. Conversely, if the price rises above the current level or the $0.46 support, it will indicate that the bulls are attempting to collect from the bottom. Buyers will have to push and sustain the price above the 20-day EMA ($0.68) to signal that the correction may be over. The pair could then rally to $0.74 and then to the 50-day SMA ($0.89).
Solana’s bounce from $37 is facing stiff resistance at the 38.2% Fibonacci retracement level of $59. This shows that the bears continue to be sold on small rallies. The bears will now try to push the price below the immediate support at $44. If successful, the SOL/USDT pair could retest the critical level at $37. A break and close below this support could drop the pair to $32. Conversely, if the price rises from the current level or support at $44, it will indicate that the bulls are buying on the dips. The bulls will then attempt to clear the overhead resistance at $59 and push the pair to the 20-day EMA ($70). This level is likely to act as a stiff resistance.
Dogecoin (DOGE) and Polkadot (DOT)
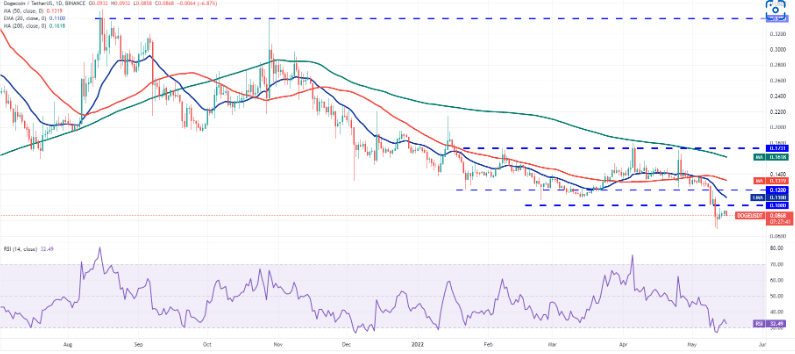
Dogecoin’s recovery failed to break above the $0.10 breakout level, suggesting that the bears are attempting to turn the level into resistance. If the sellers are successful in their efforts, the probability of a retest of $0.06 increases. This is an important level for the bulls to defend, as a break and close below it could signal a resumption of the downtrend. The DOGE/USDT pair could then drop to $0.04, where the bulls can try to stop the decline again. Alternatively, if the price rebounds from the current level, the bulls will attempt to clear the overhead resistance at $0.10 and the 20-day EMA ($0.11). If they do, the pair could rally to the 50-day SMA ($0.13).
Polkadot (DOT) broke above $10.37 breakout on May 13, but recovery stalled around $12. This indicates that sentiment remains negative and investors are selling on rallies. If the bears sink the price below $10.37, the DOT/USDT pair could decline lower towards the minor support at $8. If this level is broken, the probability of a drop below $7.30 increases. The pair could then continue its downtrend and slide towards the next strong support at $5. Alternatively, if the price recovers from $10.37 or $8, the bulls will attempt to push the pair above the 20-day EMA ($13). If they do, it will suggest that the short-term trend may have turned in buyers’ favour. The pair could then attempt a rally up to $16.
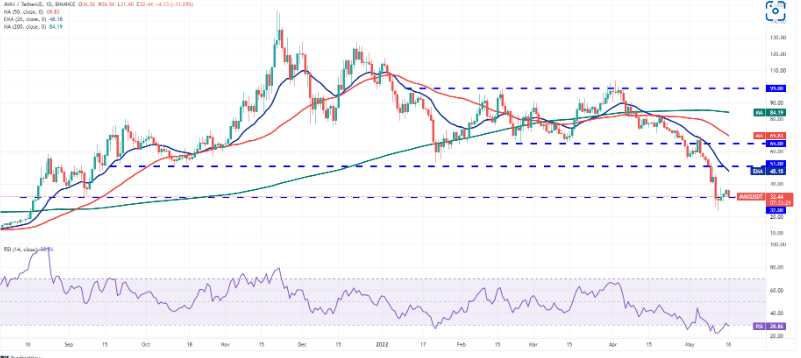
Avalanhe (AVAX) and Shiba Inu (SHIB)
AVAX recovery faces stiff resistance at $38. The shallow recovery following a sharp decline shows the bulls’ lack of aggressive buying. This can discourage bears who may try to build on their advantage. If the bears pull the price below $29, selling could pick up momentum and the AVAX/USDT pair could drop to the critical level of $23. This is an important level for the bulls to defend, as a break and close below could result in a drop to $20 and then to $18. Contrary to this assumption, if the price rises from the current level or $29, it will indicate that the bulls are buying lower. This could increase the likelihood of a relief rally to the 20-day EMA ($48), where the bears can again make a strong defense.
Shiba Inu’s recovery held the 38.2 percent Fibonacci retracement level at $0.000014 on May 13 and 14, showing that the bears are not willing to give up their advantage. The bears will once again try to push the price below the psychological level at $0.000010 and challenge the intraday low of $0.000009 made on May 12. A break and close below this level could signal a resumption of the downtrend. The SHIB/USDT pair could decline to $0.000007, which is likely to act as a strong support later. Contrary to this assumption, if the price recovers from $0.000010, the bulls will try to push the pair to the breakout level of $0.000017.