
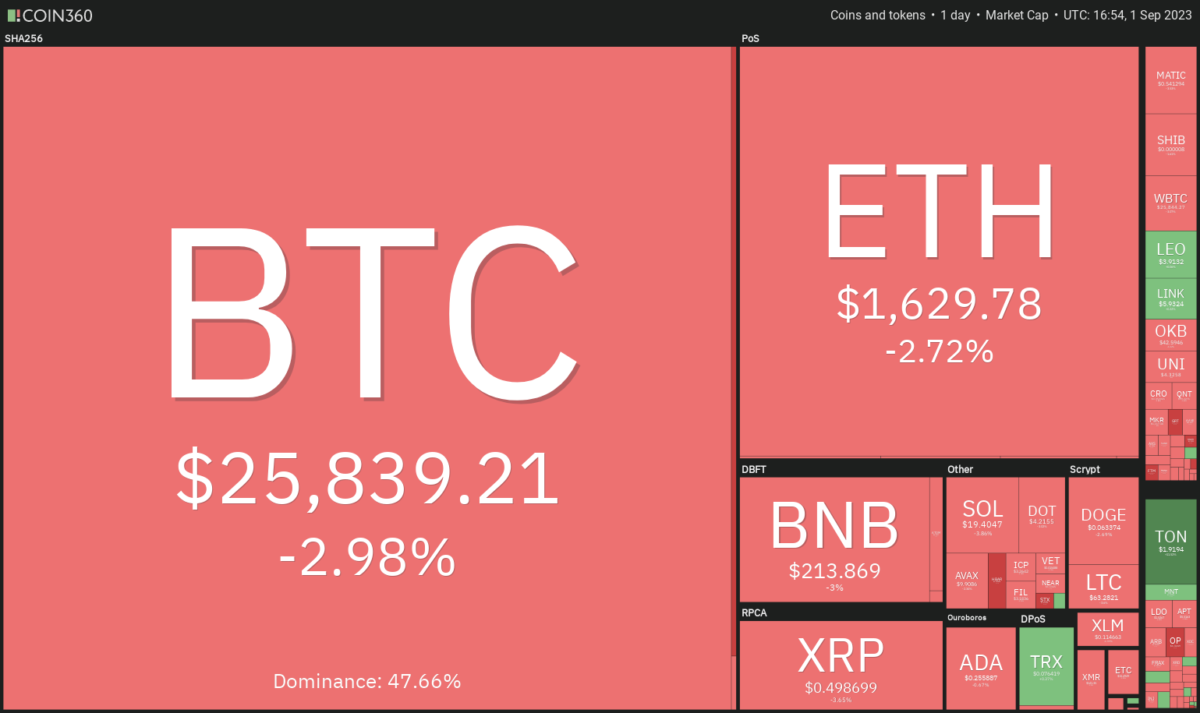
Bitcoin and most altcoins tumbled after the SEC delayed a decision on all spot Bitcoin ETF applications. On the other hand, Bitcoin’s volatility has increased over the past few days. The price rose on August 29 after Grayscale’s victory over the United States Securities and Exchange Commission (SEC). However, enthusiasm was short-lived as the price returned all its recent gains on news that the SEC has delayed the decision on all seven spot Bitcoin exchange-traded fund (ETF) applications. Now we focus on the buy-sell levels.
Bitcoin trading level
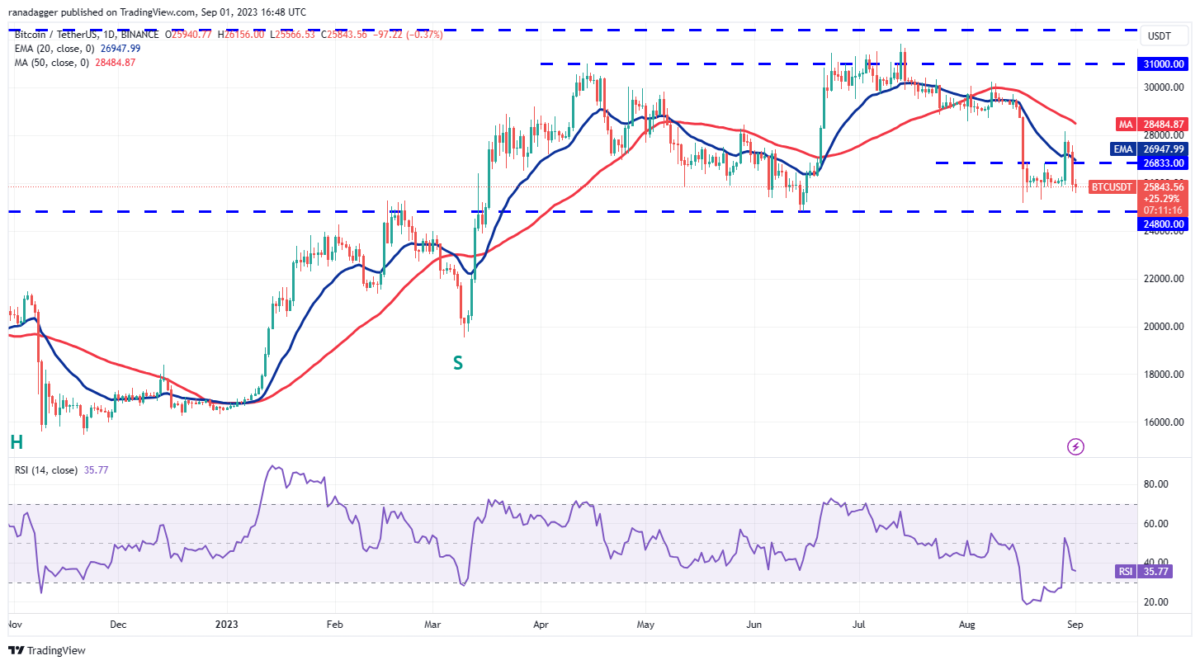
In Bitcoin, the bulls failed to maintain the 20-day exponential moving average (EMA) of $26,947 on August 31. This started a sell-off that drove Bitcoin below the $26,833 breakout level. Price movements over the past few days show the BTC/USDT pair oscillating in the wide range between $24,800 and $31,000. Typically, traders buy dips at the support of the range and sell near the resistance. The same is true for the bulls at $24,800.

If the bears want to take control, they will have to push and sustain the price below $24,800. If this happens, BTC will extend the drop to $19,500. A minor support is at $24,000. But that won’t last long.
Altcoin Ethereum trading level
The recovery from strong support at $1,626 in Ethereum faded on August 29 at $1,745. This indicates that the bears continue to be active at higher levels. The bears will try to build their advantage by pulling the price below the $1,626 to $1,550 support zone. If they are successful, this will mark the start of a new downtrend. The altcoin ETH/USDT pair will then drop to the next tough support at $1,368.
Alternatively, if the price rebounds sharply from the current level, it will indicate that the bulls are fiercely defending the support. This will bring the price down to the 20-day EMA ($1,702). Then, altcoin ETH will rise to $1,745, which can act as resistance.
Altcoin BNB trading levels
Altcoin BNB’s recovery stalled on August 29 at the 50-day simple moving average (SMA) of $234. Also, the bears pulled the price below the key $220 support on August 31. The moving averages are sloping down. On the other hand, the relative strength index (RSI) is in the negative territory. Accordingly, this shows that the bears have the upper hand. The bears will try to push the price towards the psychological support at $200. If this level collapses, the altcoin BNB/USDT will reach the next major support at $183.
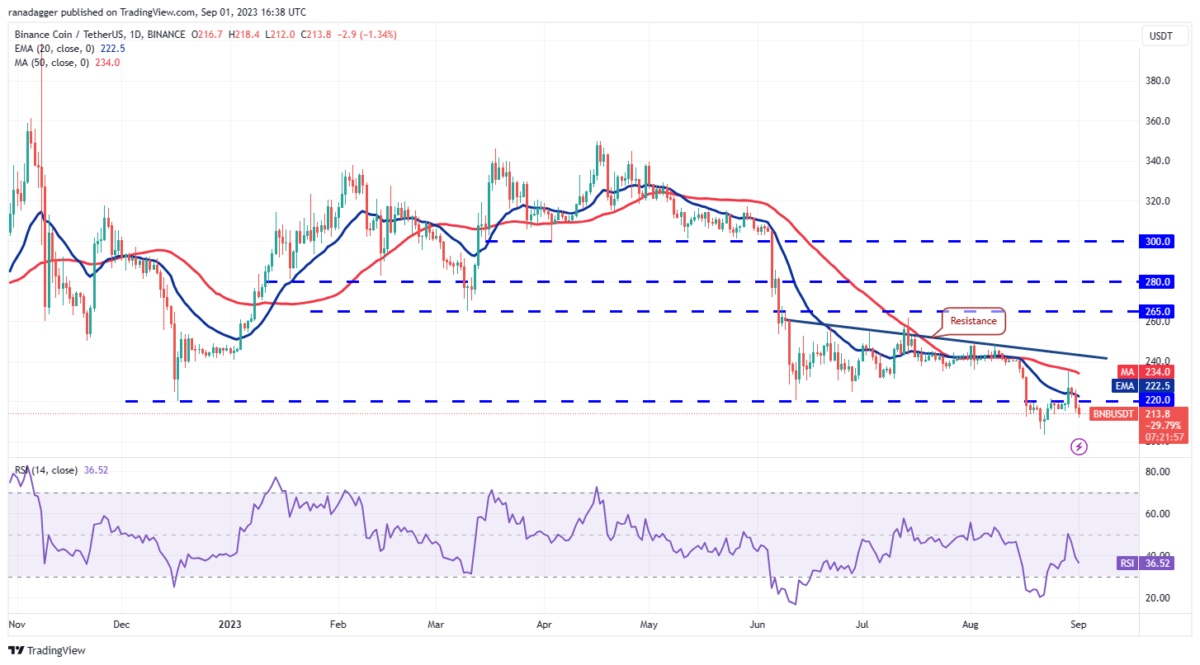
If the bulls want to start a relief rally, they will need to push the price above the 20-day EMA ($222). The pair will then climb to the 50-day SMA and then the resistance line.
Altcoin XRP trading levels
The long tail on the August 31 candlestick of altcoin XRP shows that the bulls are trying to protect the $0.50 support. However, the price action on September 1 shows that the bears are continuing the pressure. A drop below $0.50 will indicate that the bears are back in control. This will start a downside move towards the hard support at $0.41. The bulls are likely to fiercely defend this level. A bounce from support will keep the altcoin XRP/USDT between $0.41 and $0.56 for a while.
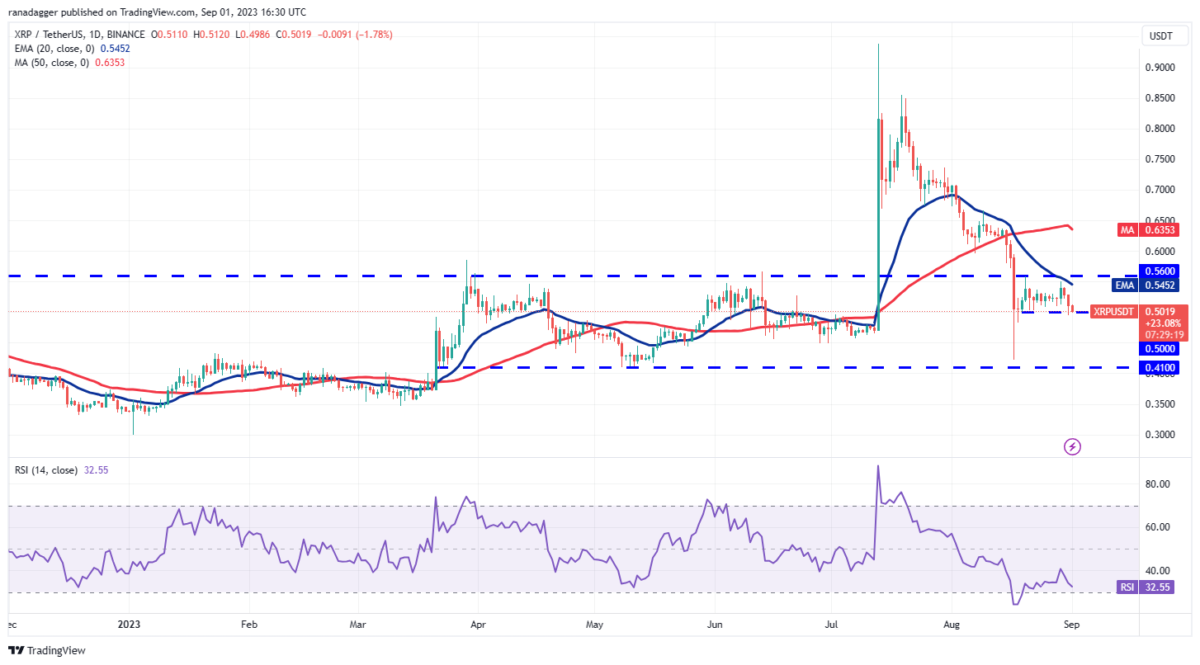
If the price bounces back from $0.50, it will indicate that the pair may attempt to rise to $0.56. The bulls will need to overcome this hurdle to start a fresh upward move towards $0.63 and then $0.73.
Altcoin Cardano trading levels
Altcoin Cardano price has been fluctuating between $0.24 and $0.28 for the past few days. The bulls pushed the price above the range on August 29. A failed to sustain higher levels. This may have encouraged long position bulls to exit their positions. Sales increased even more. Also, the price dropped below the bullish line on August 31. The bears will then try to push the altcoin ADA/USDT below the vital support of $0.24.
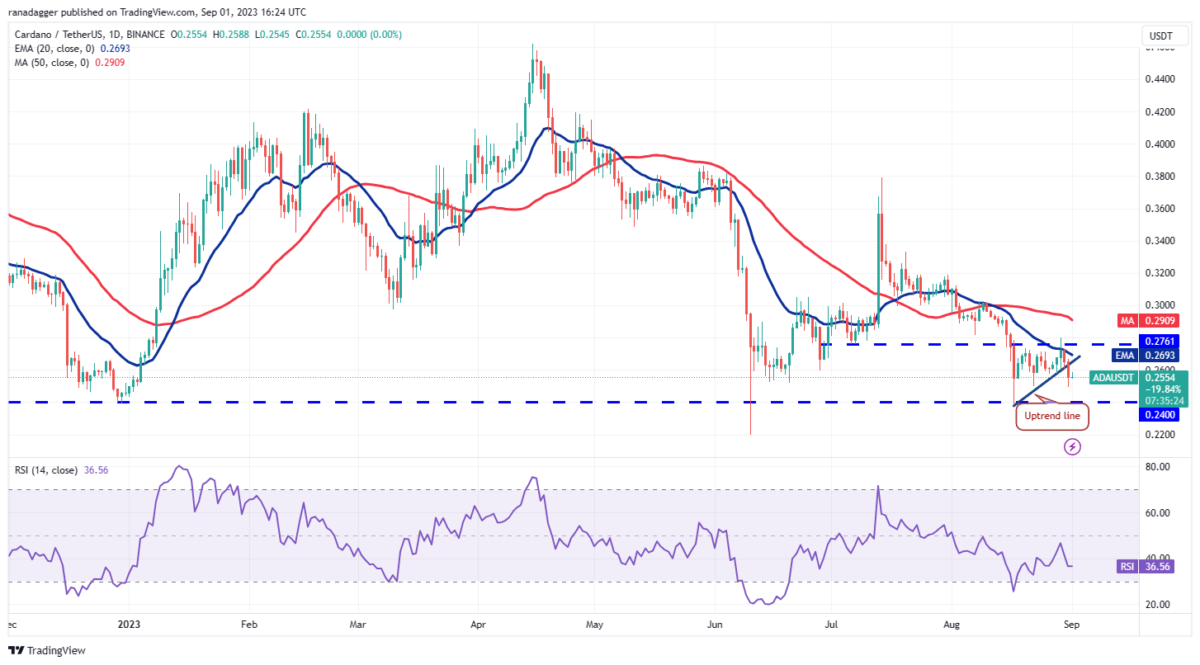
If the price recovers from $0.24, the pair will continue to consolidate within the range for a while. Conversely, if the price drops below $0.24, it will hit $0.22. Afterwards, Altcoin Cardano will mark the beginning of a decline towards $0.20.
Altcoin Dogecoin price analysis
The bulls are struggling to start a recovery in altcoin Dogecoin. The DOGE/USDT pair will drop to the solid support at $0.06. Buyers are expected to defend this level with all their might. Because a break below this will continue the downtrend. The pair is likely to slide towards the final support near $0.055 and then $0.05.
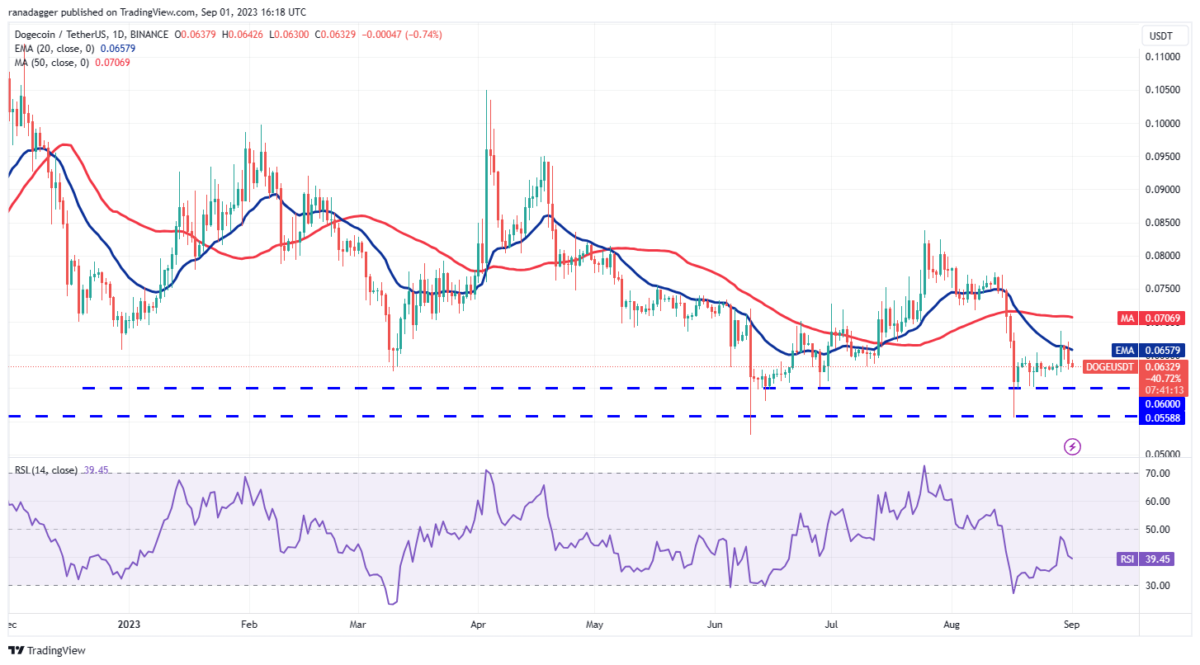
Conversely, if the price rebounds from $0.06, it will signal that the bulls have bought the dips to this level. The bulls will then try to overcome the hurdle at the 20-day EMA again. If they are successful, the pair will rise as high as $0.08 on altcoin DOGE.
Solana price analysis
Solana bounced back from the 20-day EMA ($21.37) on Aug. 30. This shows that the bears are staying in control. The price has reached the vital support at $19.35. The 20-day EMA is sloping down and the RSI is in the negative territory. Accordingly, this indicates that the path of least resistance is down. If the $19.35 support is broken, selling will intensify. Also, the altcoin SOL/USDT rate may decline to $18.
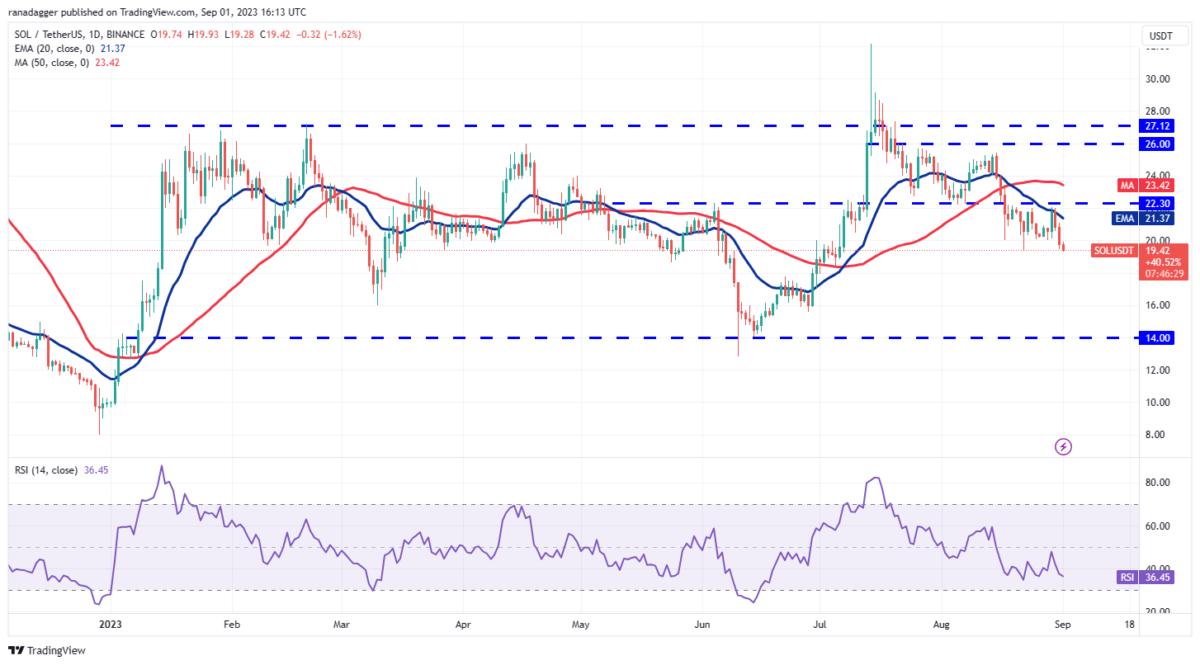
Time is running out for the bulls. If they want to start a recovery, they will need to quickly push the price above the overhead resistance at $22.30. If they do, the pair could rally towards $26. The 50-day SMA ($23.42) could act as a hurdle. However, it will likely exceed it.
Toncoin trading levels
Altcoin Toncoin (TON) is in a strong uptrend. The bears are trying to stop the rally around $1.77. But the bulls didn’t leave much ground. This shows that the bulls are not in a rush to make a profit. Buying resumed on September 1 and the TON/USDT pair reached its formation target of $1.91. If buyers reach this level, the rise will continue. On the other hand, the pair will skyrocket to $2.38. This level will witness profit realization by traders.
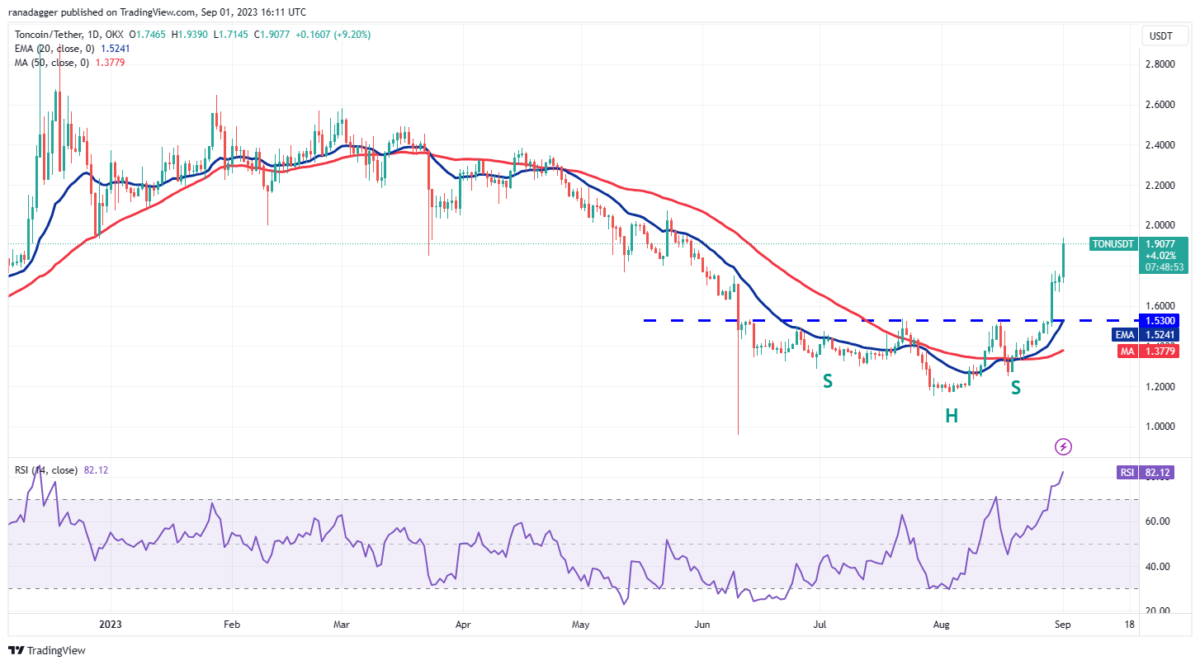
On the other hand, this bullish view will be invalidated if the altcoin TON price drops below $1.66. Such a move would signal aggressive selling at higher levels. This will push the pair down to the $1.53 breakout level.
Polkadot trading levels
Altcoin Polkadot’s turn down from the 20-day EMA ($4.56) on August 30 shows that sentiment remains negative and traders are selling in rallies. Sales increased even more on 31 August. On the other hand, the altcoin DOT/USDT pair dropped to the vital support of $4.22. This level is likely to be the scene of a battle between the bulls and bears. If the price breaks below $4.22, the pair will start the next leg of the downtrend towards $4.
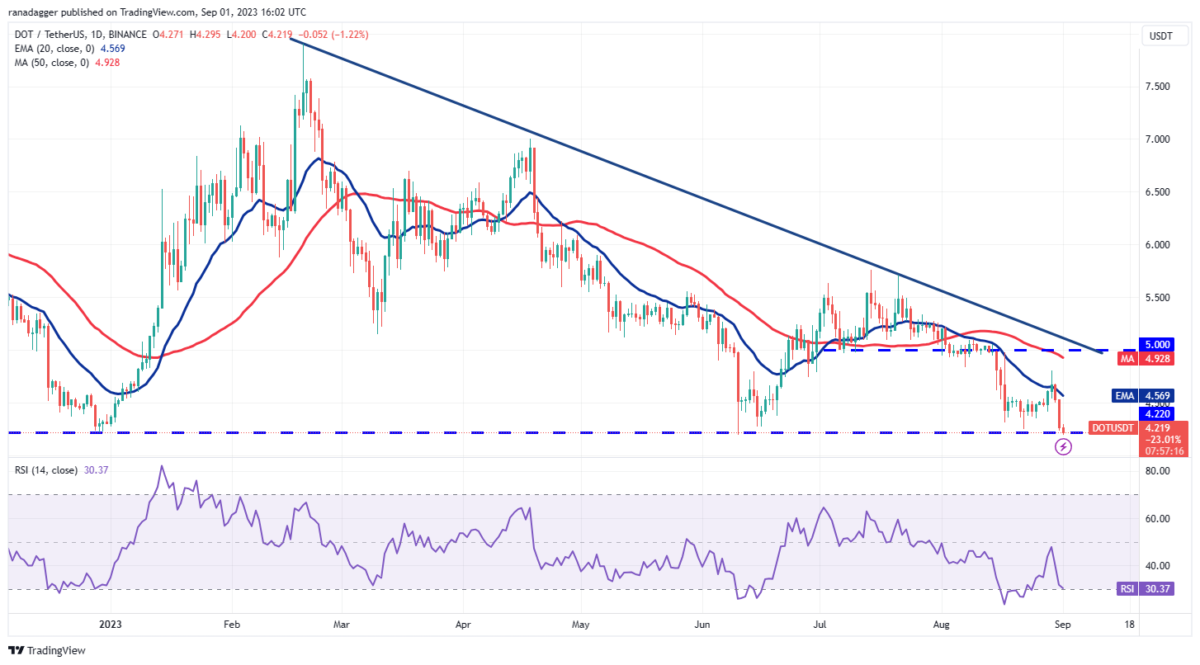
Buyers fulfill their duties. If they want to make a reversal, they will need to quickly push the price above the 20-day EMA and sustain it. Accordingly, if they succeed, the DOT will rise to the overhead resistance of $5.
Polygon trading levels
The failure of Polygon to stay above the 20-day EMA ($0.58) on August 29 may have drawn profit-taking from short-term traders. Accordingly, the bulls tried to push the price back above the 20-day EMA on August 30 and 31. But the bears held their ground. The bears will try to strengthen their position by pulling the price below the immediate support at $0.53. If they manage to do so, the altcoin MATIC/USDT will drop to the key $0.51 support.
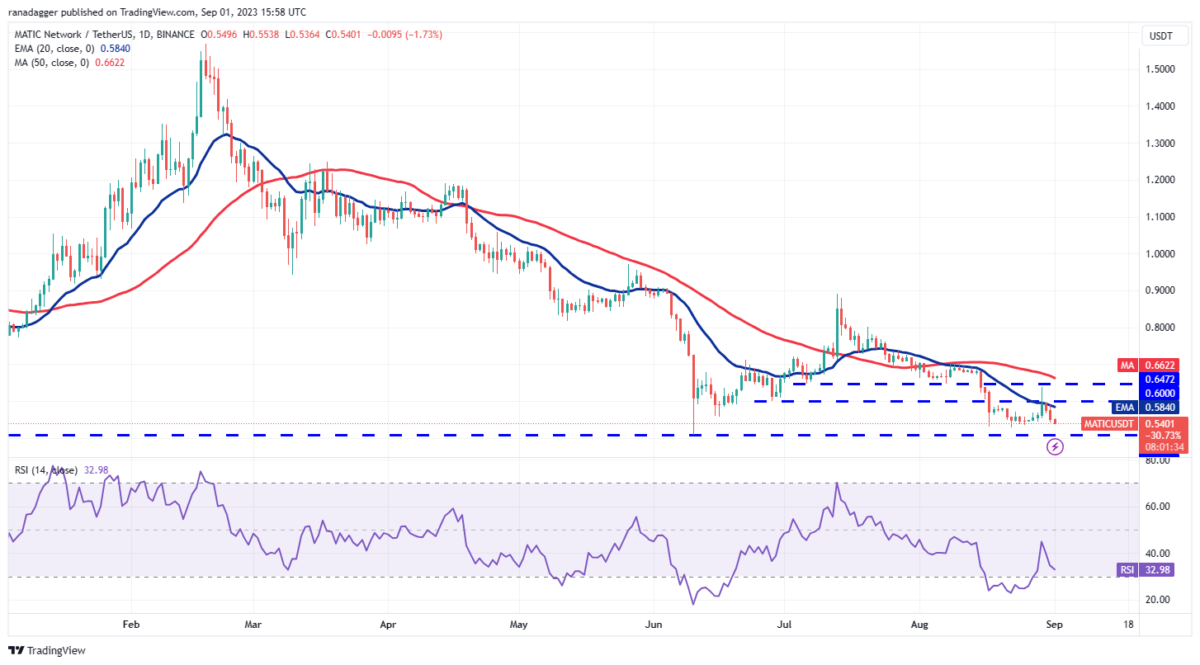
If the price turns up from the current level, it is likely to face selling at the 20-day EMA and again at the 50-day SMA ($0.66). On the other hand, a break below $0.51 will resume the downtrend. Looking at cryptocoin.com for the altcoin, the next support is at the level of $ 0.45.