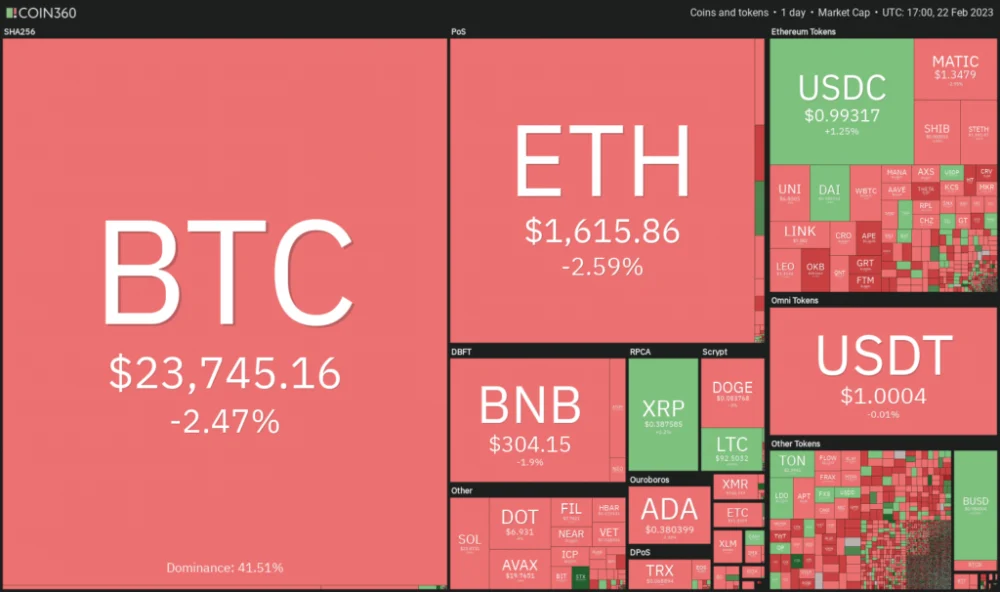
The cryptocurrency market has started to pull back. In addition, buy-sell levels have been determined for DOGE, MATIC, BTC and these 7 altcoins. cryptocoin.comWe have compiled the buy-sell levels for you.
Crypto market decline
U.S. equity markets saw their worst performance in 2023, as worried investors abandoned equities on February 21, fearing continued rate hikes by the U.S. Federal Reserve.
The decline has been relatively quiet, though the cryptocurrency markets have also reversed some of the gains. Dylan LeClair, senior analyst at UTXO Management, said that Bitcoin’s correlation with the S&P 500 index has dropped to its lowest level since late 2021.
After a sharp recovery from lows, Glassnode data showed that only 21% of cryptocurrencies sent to exchanges by Long-Term Holders earlier this week were losing ground. This is a huge improvement over mid-January when 56% of LTH coins sent to exchanges were carried in losses.
The divergence of the crypto and US stock markets is a positive sign, but traders should remain cautious. If stocks drop sharply and a sense of risk aversion develops, the crypto rally may struggle to sustain its gains.
DOGE, MATIC, BTC and trade levels for these 7 altcoins
BTC/USDT
Bitcoin was once again rejected at $25,211 on February 21, which may have spurred short-term bulls to give up and take profits. This could push the price towards the first major support at the 20-day exponential moving average ($23,364).
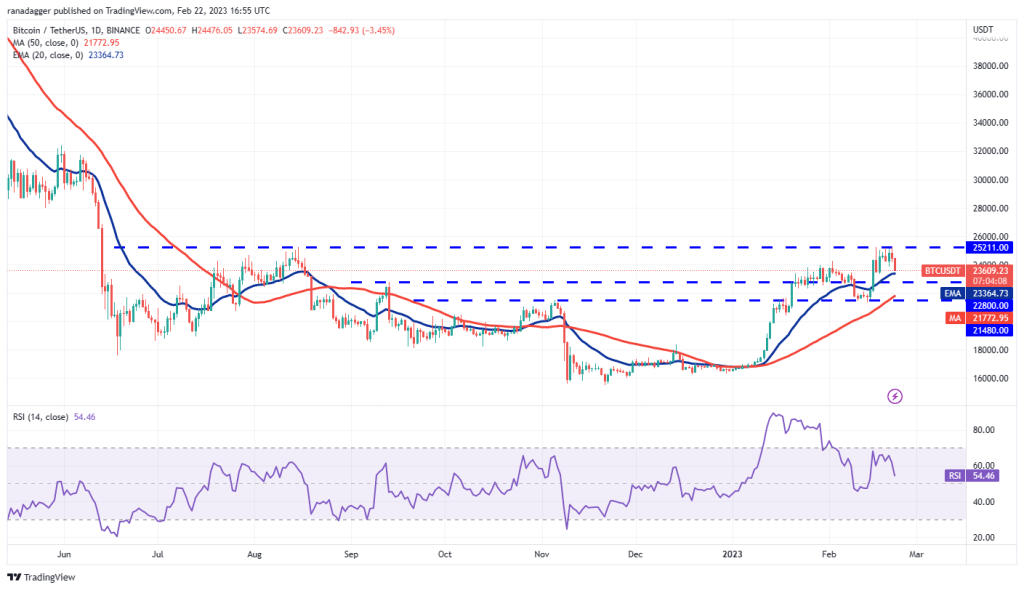
In an uptrend, buyers try to protect the 20-day EMA followed by the 50-day simple moving average ($21,772). If the price bounces back from the 20-day EMA, it will show that the bulls are not waiting for a deeper correction to buy. This could increase the probability of a rally above $25,250.
On the contrary, if the price drops below the 20-day EMA, it will indicate that traders are rushing to the exit. This could result in a drop to the 50-day SMA. The BTC/USDT pair may attempt to rebound, but on the upside, the 20-day EMA could pose a strong challenge. The short-term trend could turn in favor of the bears if the price closes below the critical support at $21,480.
ETH/USDT
Although Ether has remained above the $1,680 level since Feb. 17, the bulls failed to break through the $1,743 overall barrier. This may have attracted sales from short-term traders.
The price declined on February 21 and settled below the $1,680 breakout level. Sellers will now try to build on this advantage and try to push the price below the 50-day SMA ($1,550).
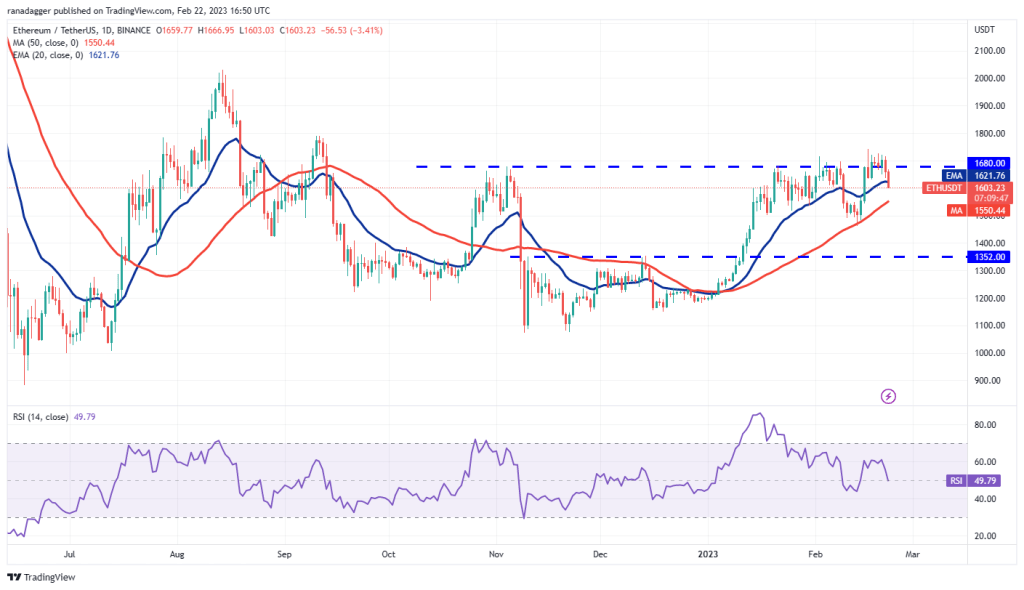
If they manage to do so, the ETH/USDT pair could drop to immediate support at $1,461. The bulls are expected to defend this level strongly because if this support is broken, the pair could drop to $1,352.
The bulls will have a chance if they quickly push the price above $1,680. Such a move will indicate aggressive buying on small dips. A break above $1,743 could start the next leg of the rise to $2,000.
BNB/USDT
Even after repeated attempts, the bulls have been unable to push BNB above the overhead resistance of $318 over the past few days. This shows that the bears are fiercely defending the $318 level.
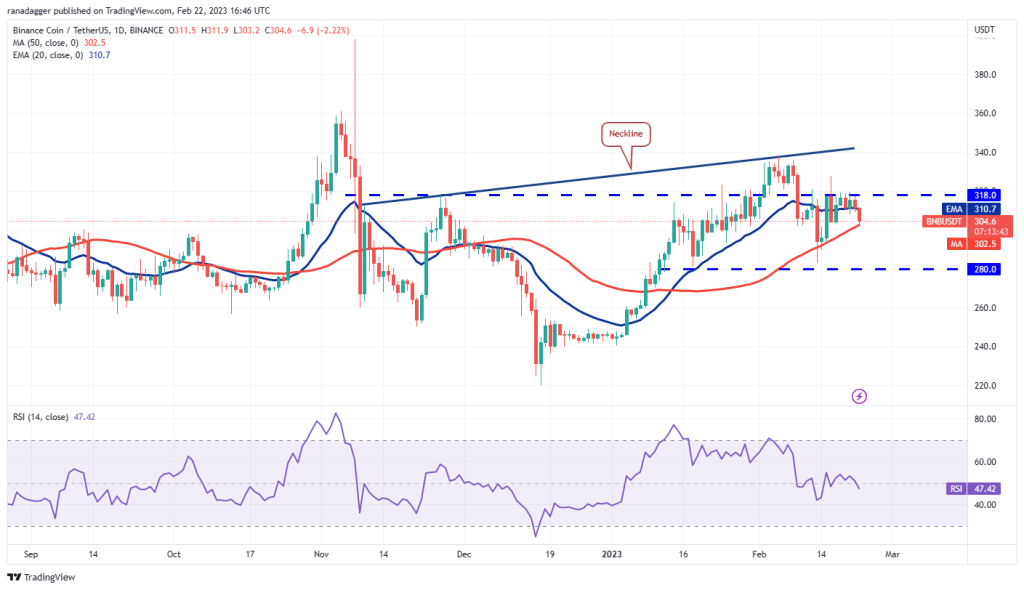
The bears will try to leverage their advantage by pulling the price below the 50-day SMA ($306). If successful, the BNB/USDT pair could decline towards the next major support at $280. If the price bounces back from this level, the pair could oscillate between $318 and $280 for a few days.
The flat 20-day EMA and the RSI near the midpoint also indicate range-bound action in the near term. The bulls will need to push the price above $318 to gain the upper hand.
XRP/USDT
XRP continues to trade within the descending channel pattern. The bears thwarted the bulls’ efforts to push the price above the resistance line on February 20.
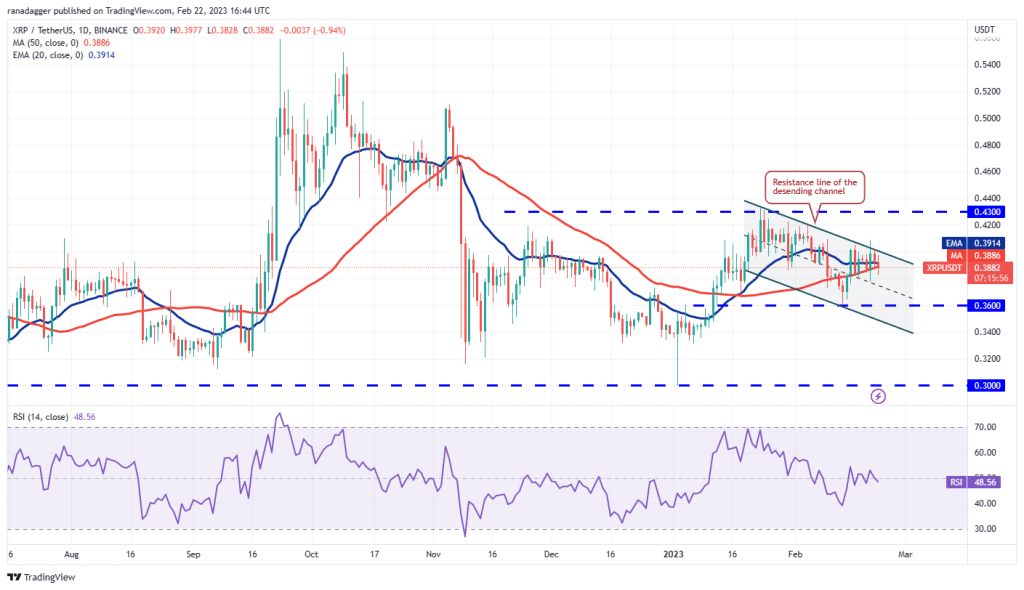
The 20-day EMA ($0.39) has flattened and the RSI is near the centre, indicating an equilibrium between supply and demand. If the price dips below the moving averages, the bears will attempt to push the price towards the critical support at $0.36.
Alternatively, if the price rises from the current level and breaks above the channel, it will offer the bulls an advantage. The XRP/USDT pair could then attempt an upward move towards $0.43, where the bears are likely to form stiff resistance.
ADA/USDT
Cardano is trading in a narrow range between the neckline of the inverted head and shoulders pattern and the immediate support at $0.38.
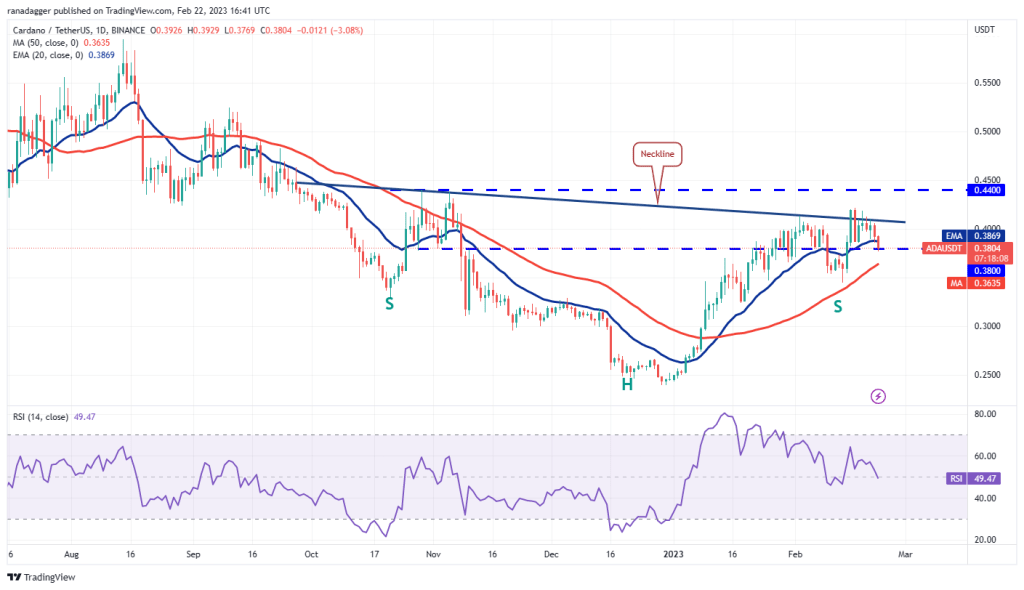
The 20-day EMA ($0.39) has flattened out and the RSI is close to 50, indicating an equilibrium between the bulls and bears. If the price rises from the current level or the 50-day SMA ($0.36), the bulls will make another attempt to break through the overall hurdle.
If they do, the bullish setup will complete and the ADA/USDT pair could rally to $0.52 and then $0.60. Conversely, a break below the 50-day SMA could pull the price into the strong support zone of $0.32 to $0.34.
DOGE/USDT
Price action in Dogecoin (DOGE) has been stagnant for the past few days. This shows that both bulls and bears are cautious and do not place big bets.
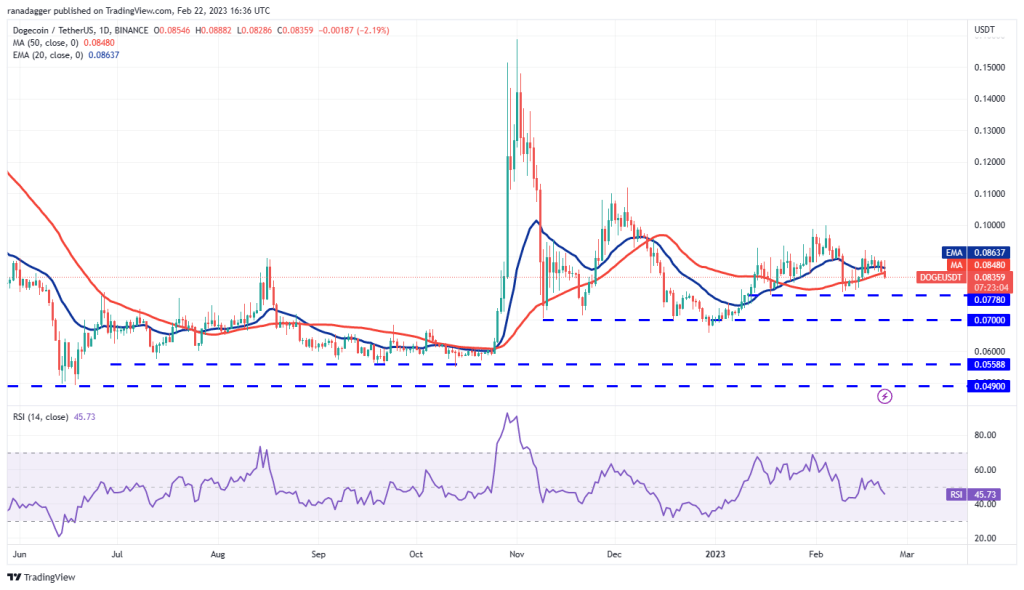
The flat moving averages and the RSI just below the midpoint do not point to an advantage for either side. This indicates that the DOGE/USDT pair could oscillate between $0.10 and $0.08 for a while.
On the upside for DOGE, a break above $0.10 might put the $0.11 resistance at risk. If this happens, the pair could gain momentum and rally to $0.15. Conversely, a break below $0.08 could clear the way for a retest of solid support at $0.07.
MATIC/USDT
The long tail on the February 20 candlestick shows that the bulls bought the dip in hopes that Polygon would continue the uptrend, but that did not happen. The bears sold the recovery above $1.50 on Feb. 21, which started a pullback.
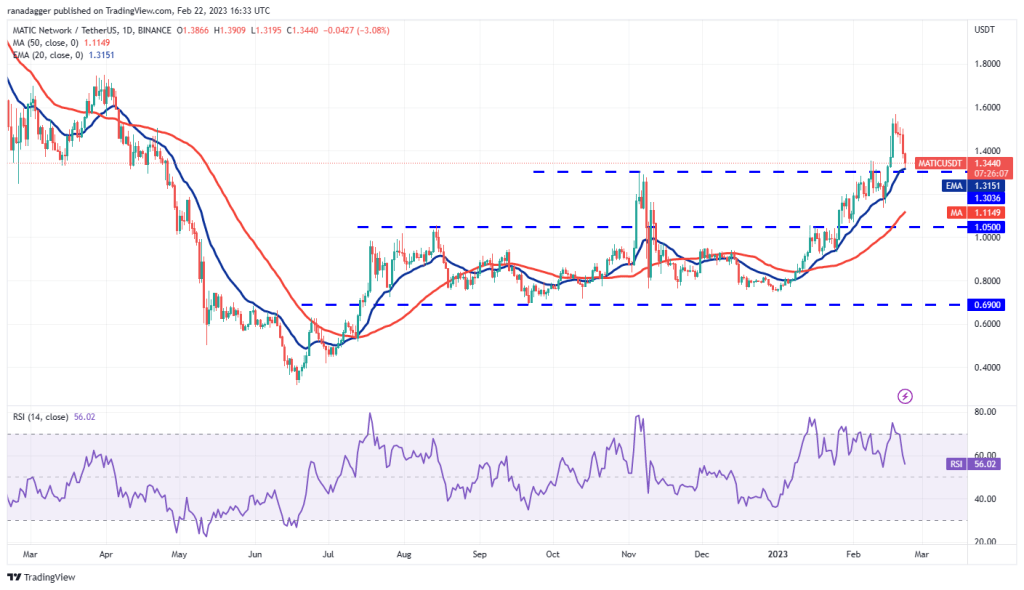
The bulls will have to hold the $1.30 level if they want to keep the uptrend intact. If the price bounces back from the current level, the MATIC/USDT pair may attempt to rise again to the overhead resistance of $1.57. Buyers will have to break through this hurdle to start the next leg of the uptrend.
Conversely, if the price drops below the 20-day EMA, it will suggest that traders can take profits. This could open the doors for a drop towards the 50-day SMA ($1.11).
LEFT/USDT
Solana broke above the resistance line on February 20, but the bulls were unable to sustain higher levels. This shows that the bears continue to defend the resistance line.
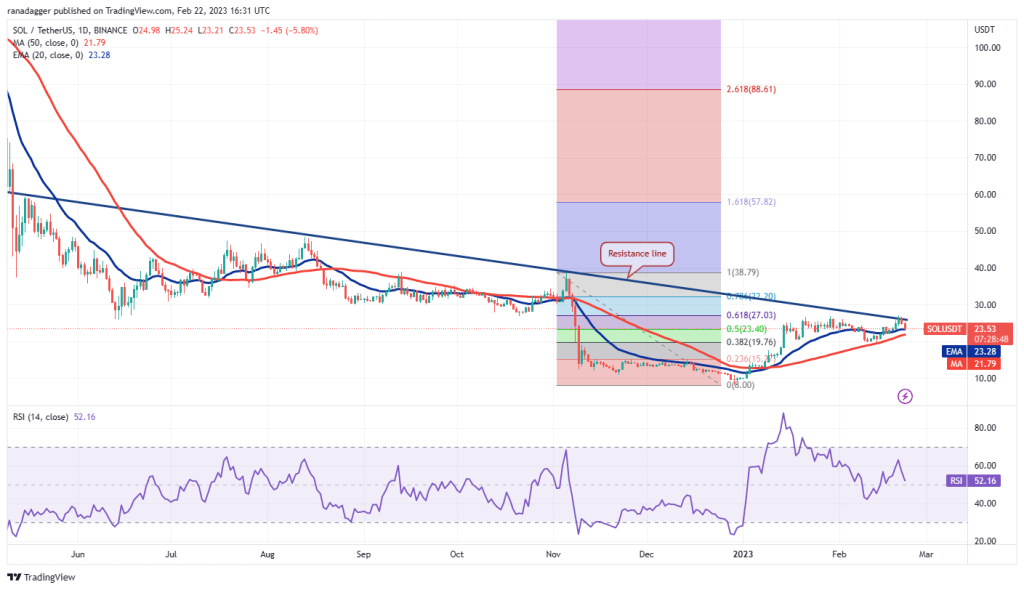
If the price continues to drop and breaks below the moving averages, the bears will try to consolidate their position by pulling the SOL/USDT pair below the key support at $19.68. If they manage to do so, the pair could drop to $15.
On the other hand, if the price rises from the moving averages, the bulls will try another chance to break through the resistance line. If the price closes above $28, the bears might give up and the pair could accelerate towards $39.
SHIB/USDT
The Shiba Inu has been stuck in a wide range between $0.000007 and $0.0000018 for the past few months. The bulls tried to push the price to the resistance of the range, but the bears had other plans. They stopped the rally near $0.0000016.
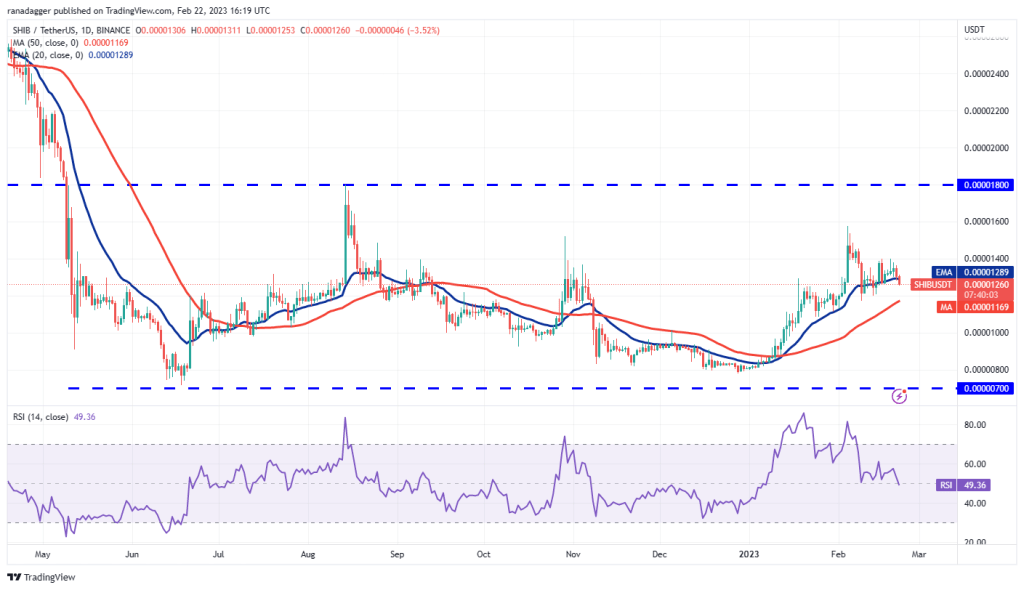
The bulls repeatedly bought dips to the 20-day EMA ($0.000013) but were unable to push the price above $0.000014. This shows that traders are easing their positions in the rallies. The price has once again dropped below the 20-day EMA and the bears will attempt to push the SHIB/USDT pair down to $0.000011.
The flattening 20-day EMA and the RSI near the midpoint indicate that the bullish momentum is weakening. If buyers want to take control, they will have to quickly push the price above $0.000014. If they do, the pair could rally to $0.000016 and then to $0.000018.

