As we reported on
Kriptokoin.com, stock markets in the United States rose sharply on May 25 and 26, but Bitcoin (BTC) and altcoins did not follow a similar trajectory. This shows that investors aren’t sure that major cryptocurrencies like BTC and SHIB have bottomed yet. Could Bitcoin follow the US stock markets more, or will it diverge and continue its price collapse at lower levels? We present the analyzes and analyst opinions prepared for BTC, SHIB, DOGE and 7 major altcoins.
Here are the critical levels for DOGE, SHIB, BTC and 7 major altcoins
Bitcoin (BTC) and Ethereum (ETH)
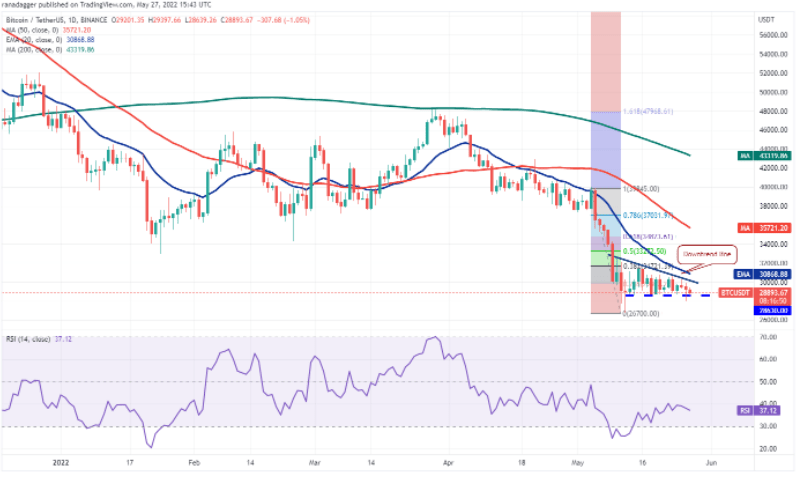
Bitcoin, 28.630 on May 26 The dollar fell below the strong support, but the bulls failed to sustain the lows. The bulls are again trying to defend the $28,630 support, which is an important level to watch out for. If the price rebounds from the current level and rises above the 20-day exponential moving average (EMA) ($30,868), it will suggest that the BTC/USDT pair may have bottomed out. The pair could then rise to the 50-day simple moving average (SMA) ($35,721). Conversely, if the price declines from the current level or overhead resistance, it will indicate a lack of demand at higher levels. This could increase the possibility of a drop below $28,630. If this happens, the pair could retest the critical level at $26,700. A break and close below this level could intensify the sell-off and the pair could drop as low as $20,000.
Ethereum (ETH) broke below the uptrend line and closed on May 25, suggesting that the bears are trying to re-establish their edge. Sales gained momentum on May 26 and the price dropped below $1,800, the intraday low of May 12. The bears are trying to defend the critical support at $1,700 but the recovery lacks momentum. This suggests that the bulls are not buying aggressively from support. This may discourage bears who may try to sink and sustain the price below $1,700. If they are successful, the ETH/USDT pair could drop to $1,300. Conversely, if the bulls successfully defend the support at $1,700, the pair could start an upward move towards $2,159. This could keep the pair between $2,159 and $1,700 for a few more days.
BNB and Ripple (XRP)
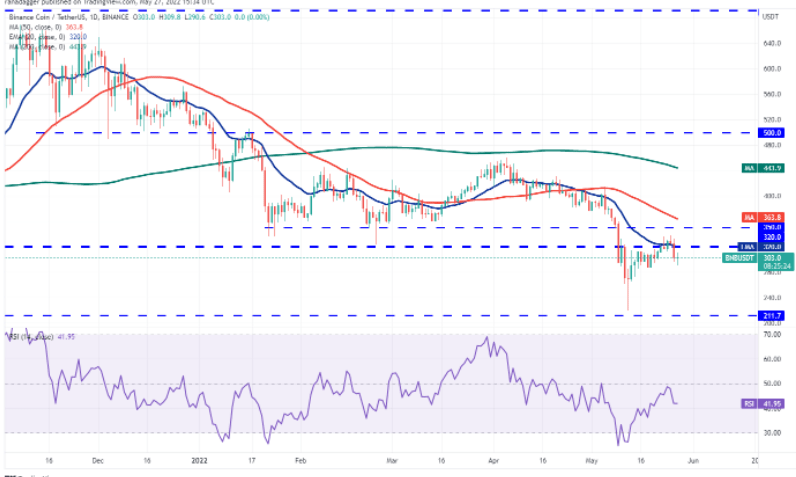
The long wick on BNB’s May 25 candlestick indicates that the bears are selling on rallies approaching the critical overhead resistance at $350. Selling continued on May 26 and the price dropped below the 20-day EMA ($320). There is a minor support at $286 where the bulls will attempt to stop the decline. If they are successful, it will show that sentiment has changed from selling at rallies to buying at dips. The bulls will then make another effort to push the price up to $350. Alternatively, if the price dips below $286, it will suggest that aggressive bulls who may have been trapped after buying the break above $320 may exit their positions. This could bring the BNB/USDT pair down to $260.
Ripple (XRP) broke below the critical support of $0.38 on May 26, but the long tail on the day’s candlestick indicates strong buying at the lower levels. Buyers will try to push the price towards the downtrend line. If the price turns down from the downtrend line, the bears will try to push the XRP/USDT pair back below $0.38. If this happens, the pair could drop to its May 12 intraday low at $0.33, where the bulls are likely to form a strong defense. The bears will have to push the price below this support to indicate the resumption of the downtrend. On the other hand, if the bulls push the price above the downtrend line, the pair could rally to the 20-day EMA ($0.44). This level could act as a stiff resistance again, but if the bulls break this hurdle, the recovery could reach the psychological level of $0.50.
Cardano (ADA) and Solana (SOL)
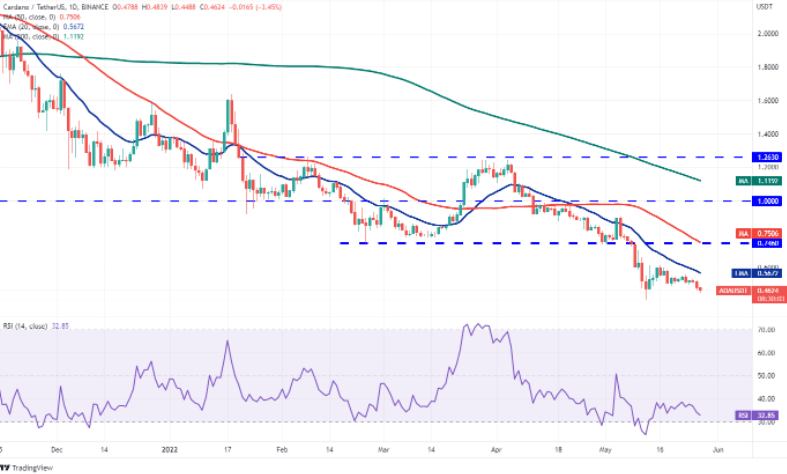
Cardano (ADA) between $0.49 and $0.56 tight futures transactions were resolved to the downside on May 26. The bulls are trying to defend the minor support at $0.46, but if they fail, the drop could extend to $0.40. The downward sloping moving averages and the RSI near the oversold zone suggest that the bears are in command. If the bears sink and hold the price below $0.40, selling could gain momentum and the ADA/USDT pair could drop to $0.33. Conversely, if the price reverses from the current level or support, it will suggest strong buys at lower levels. The bulls will then try to push the price above the 20-day EMA ($0.56). If they are successful, the pair could rally to $0.61 and later to $0.74.
Solana (SOL) broke below the critical support of $47 on May 26, suggesting that investors who may have bought lower have closed their positions. This opens the doors for a possible drop to the critical support at $37.37. If the price recovers from $37.37, buyers will try to push the price to the 20-day EMA ($55). This is an important level for the bears to defend, as a break and close above it would suggest that the SOL/USDT pair may have bottomed out. The pair could then attempt a rally to the overhead resistance at $75. Alternatively, if the bears sink the price below $37.37, it will suggest a resumption of the downtrend. The pair could then extend its decline to the next support at $32.
Dogecoin (DOGE) and Polkadot (DOT)
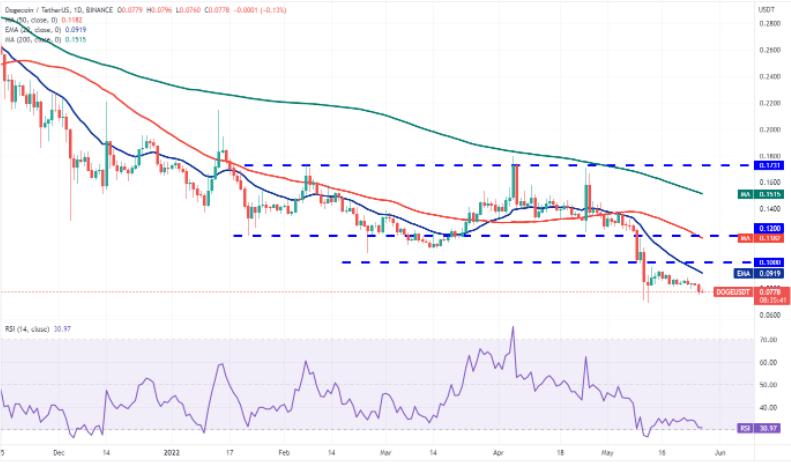
Tight futures trading of Dogecoin (DOGE) was resolved to the downside on May 26 and bears price reached $0.08. pulled under. If the bears hold the price below $0.08, the DOGE/USDT pair could drop to the vital support at $0.06. As this level acts as a strong support on May 12, the bulls may try to defend it again. If the level continues, the pair could climb towards the 20-day EMA ($0.09). Another possibility would suggest that if the bulls push the price above $0.08, demand will be lower. Buyers will then try to push the price towards the 20-day EMA. A break above this resistance could push the price higher towards the psychological $0.10 level later on.
Polkadot (DOT)’s failure to climb above the breakout level of $10.37 attracted sales by investors. The bears pushed the price below the critical support of $9.22 on May 26, but they are struggling to sustain lower levels. The price recovered from the immediate support at $8.56 and the bulls are attempting to clear the overall hurdle at the 20-day EMA ($10.88). If they do, it will suggest that the downtrend may be weakening. Contrary to this assumption, if the price turns down from overhead resistance once again, the bears will try to push the DOT/USDT pair below $8.56. If they do, the next stop could be $7.30. The bulls are likely to defend this level aggressively, but if they fail in their efforts, the pair could initiate the next leg of the downtrend.
Avalanche (AVAX) and Shiba Inu (SHIB)
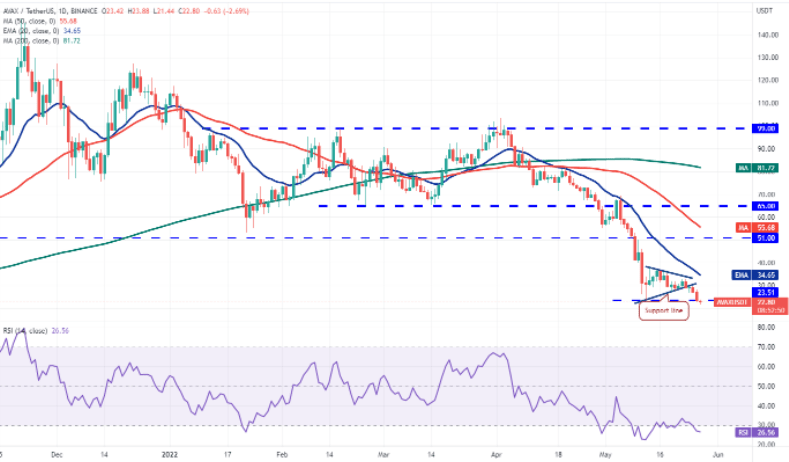
Avalanche (AVAX) continued its decline and broke below the key $23.51 support on May 26. This indicates the resumption of the downtrend. While the downward sloping moving averages are supporting the bears, the RSI in the oversold region indicates a relief rally or consolidation in the near term. If the price rallies and rises above $23.51, it could trap a few aggressive bears and cause a short squeeze. This could push the AVAX/USDT pair to the 20-day EMA ($34). Alternatively, if the bears hold the price below $23.51, selling could gain momentum and the pair could drop to the psychological support at $20
Shiba Inu (SHIB) remains under pressure . Although the bulls defend the support at $0.0000010, the recovery lacks strength. This points to weak demand at current levels. The bears will try to push the price below $0.000010 and if they are successful, the SHIB/USDT pair could drop to the critical support at $0.000009. This is an important level to watch out for, as a break and close below it could indicate a resumption of the downtrend. The pair could later slide as low as $0.000007. Alternatively, if the $0.000010 level holds, the pair could rally to the 20-day EMA ($0.000013). This level could act as a resistance again, but if surpassed, the upside move could reach $0.000017.