Important analyzes came to the fore for Bitcoin (BTC), Ethereum (ETH), Chainlink (LINK) and Cardano (ADA), which are popular cryptocurrencies. Here are the expectations for these four cryptocurrencies…
Cardano before ETH: What are the prospects for Bitcoin?
According to analyst Tony M., Bitcoin bulls are eyeing $26,500. Bitcoin price is currently trading at $24,646. The 8-day exponential moving average (EMA) is approaching an uptrend above the 21-day simple moving average (SMA), which could potentially lead to a spike into higher price levels. Conflicting indicators suggest that in the short term, the trend is moving towards an uptrend and will likely attract more buyers to the market.
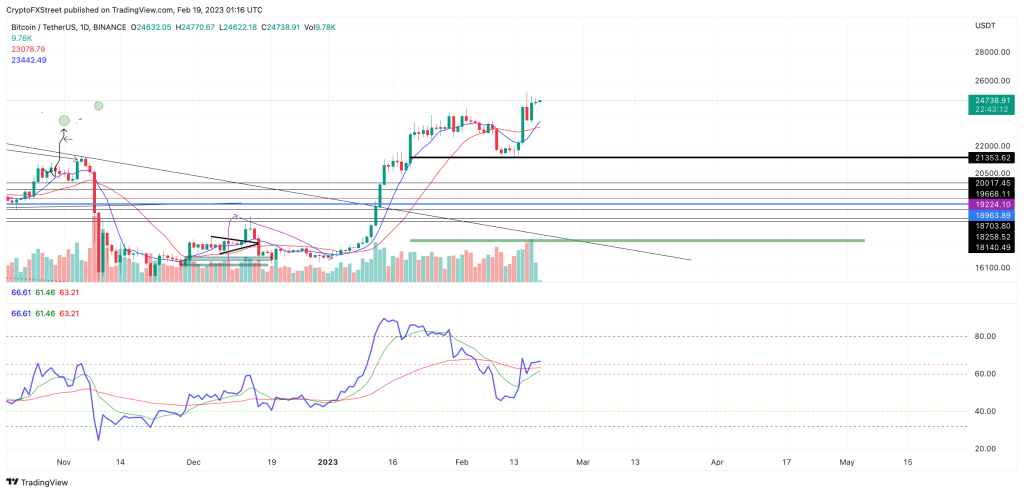
Considering the potential crossover of the 8-day EMA above the 21-day SMA, there is a chance that Bitcoin price will hit a $25,000 hurdle. A conservative target would be the $26,500 level, an unlabeled level of liquidity from the liquidation event of 2022. A breach of the $26,500 zone would result in a 7.4 percent increase in market value, according to the analyst. The invalidation of the bullish thesis happens if the price of Bitcoin drops below the $22.985 crossover indicators. If the breakout occurs, Bitcoin could potentially retest the support level at $21,000, which would mean a 15 percent drop from Bitcoin’s price today.
These are critical levels for Cardano
Cardano price is showing signs of an ongoing uptrend after the spike on Jan. 17. Cardano price is currently hovering around $0.45. The relative strength index suggests caution should be exercised when targeting higher price levels, as this week’s $0.420 high diverges from previous highs to the $0.30 region, near the $0.40 barrier. This could be an early signal of a market reversal, but traders will only be able to detect it after a bearish move.
Considering these factors, a healthy risk management should be applied but the ascension thesis should be maintained. The next level the bulls will target will be the $0.43 region, which results in a 9 percent increase from Cardano’s current price. The invalidation of the bullish thesis is currently below the swing low above the spiral moving averages at $0.385. This will allow traders to participate in the bullish action while keeping their risk extremely low. If the override point is exceeded, traders can wait for a drop to the $0.30 region to challenge the starting point of the divergence of the relative strength index.
Leading altcoin Ethereum stands out
Ethereum price is consolidating within an overall uptrend, but there are signs of a potential trend reversal, according to analyst Tony M. ETH price trades depending on the trading range, giving traders time to consider which side of the market they want to join. Ethereum price is currently trading at $1,684 as the bulls face resistance near the $1,700 zone. The Relative Strength Index (RSI) is trending bearish with previous highs near the $1,700 hurdle formed earlier in the month and highs of the mid $1,600 region. The divergence in the RSI shows that the underlying strength of the uptrend is decreasing.

Still, the uptrend remained intact as there was a squeeze on both the 8-day exponential moving average and the 21-day simple moving average. Compression usually occurs when an asset is subject to volatile fluctuations. In this case, the short-term trend for Ethereum is bullish as ETH price is above the squeeze indicators. Given these factors, there is a chance for the $1,800 medium liquidity zone to be tagged in the coming days. The bullish scenario creates the potential for a 10% increase from the current price of ETH. However, ETH price could potentially drop to the $1,265 support zone, resulting in a 25% drop from Ethereum’s current market cap.
Is there selling pressure for Chainlink?
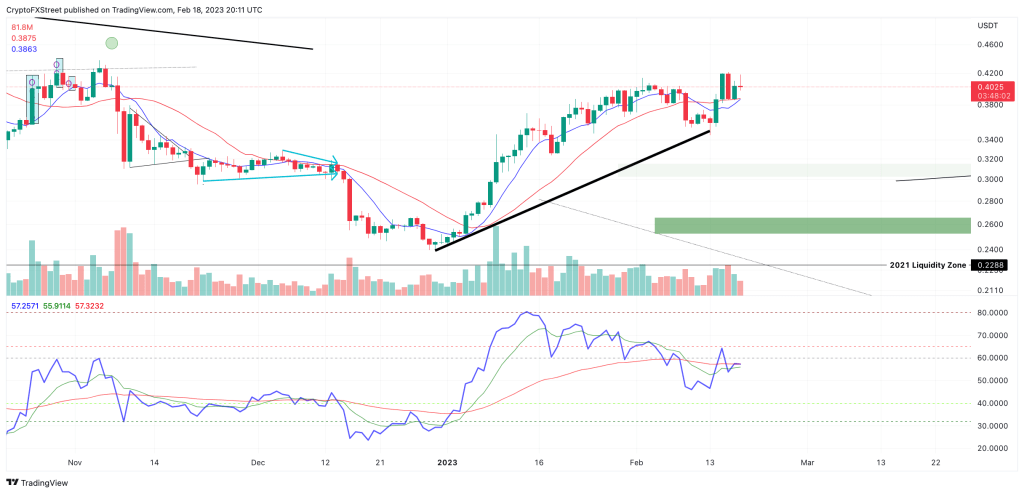
Chainlink has reached a significant selling pressure zone above $7.5, according to analyst Suzuki Shillsalot. LINK has been in a consolidation phase for the past few weeks. It oscillated between a critical supply (red) and demand (green) region. So far, the supply zone above $7.5 has been a challenge for the bulls. LINK is bullish on the 12-hour chart, as evidenced by its RSI value. Similarly, OBV (balance volume) rose, supporting the recent uptrend but facing bearish. The region has also been a critical resistance level on the three-hour charts. As a result, the bulls may have trouble tackling it, especially if BTC fails to regain the $25,000 level.
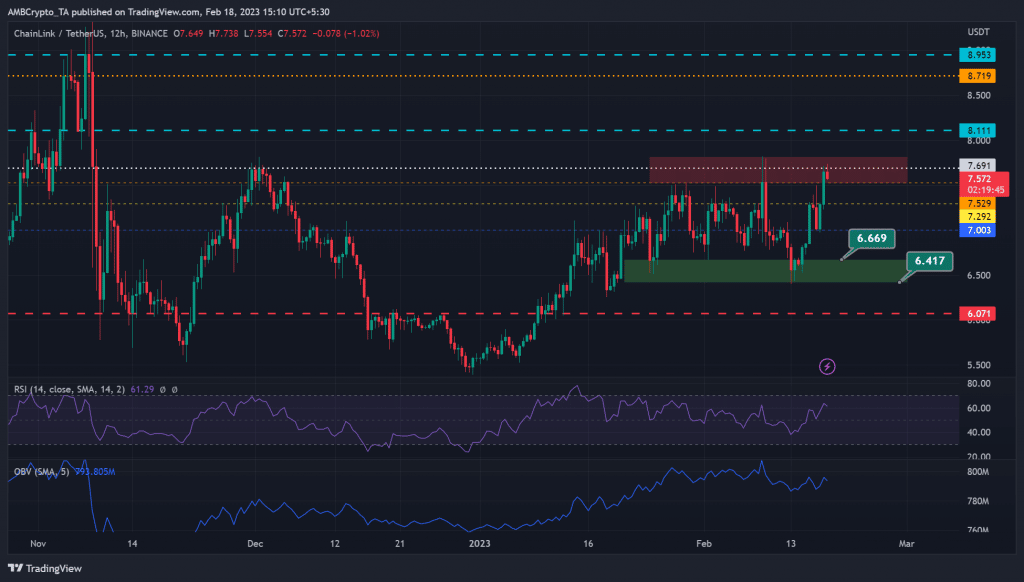
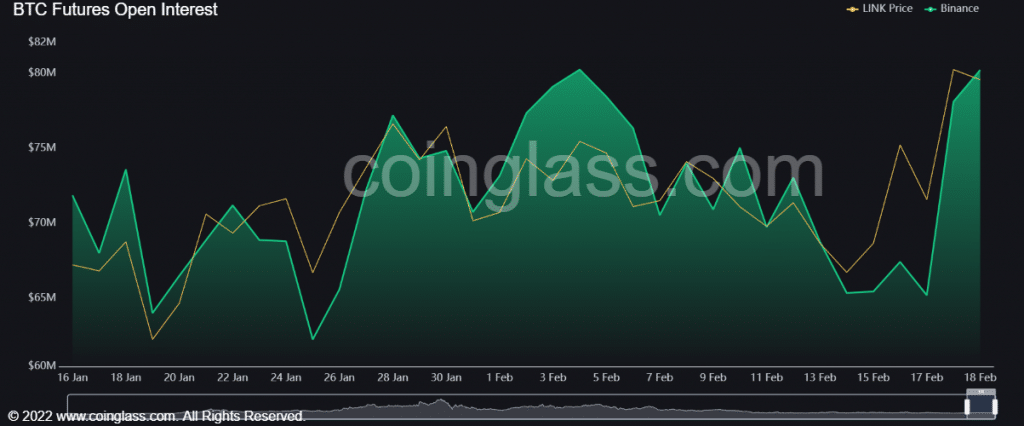
Therefore, if the price correction extends into the demand zone (green), the bears could profit from short selling opportunities at $7.52 or $7.29. The $7 or $6.6 levels can also be ideal buying opportunities, so sellers can lock in their profits at these levels. According to Coinglass, LINK’s open interest (OI) rate has increased tremendously since February 17. A rally above $7.5 and a steadily rising open interest will give the bulls momentum to target $8. However, any decrease in OI will give the bears more market influence.