
Crypto analyst Valdrin Tahiri says Shiba Inu (SHIB) is trading in a critical horizontal support area. The analyst asks, “will it bounce or break?” He is looking for an answer to his question.
Shiba Inu can’t log out
cryptokoin.com As you can see from , there is a cloudy atmosphere in the market. Technical analysis on the weekly timeframe shows that SHIB price has fallen below a descending resistance trend line since August 2022. So far, the trend line has been in place for 470 days. Shiba Inu was rejected by the trend line last week and the week before (red icons). This started the ongoing downward movement. These were the third and fourth rejections from this trend line.
SHIB price is trading in a descending wedge. However, it has not yet confirmed the support line (dashed) in sufficient numbers. When evaluating market conditions, investors use the RSI as a momentum indicator to determine whether a market is overbought and whether an asset should be accumulated or sold. If the RSI value is above 50 and the trend is upward, the bulls still have the advantage. However, if the value is below 50, the opposite is true. The weekly RSI value is just above 50. Additionally, the RSI indicates an uncertain trend for the Shiba Inu.
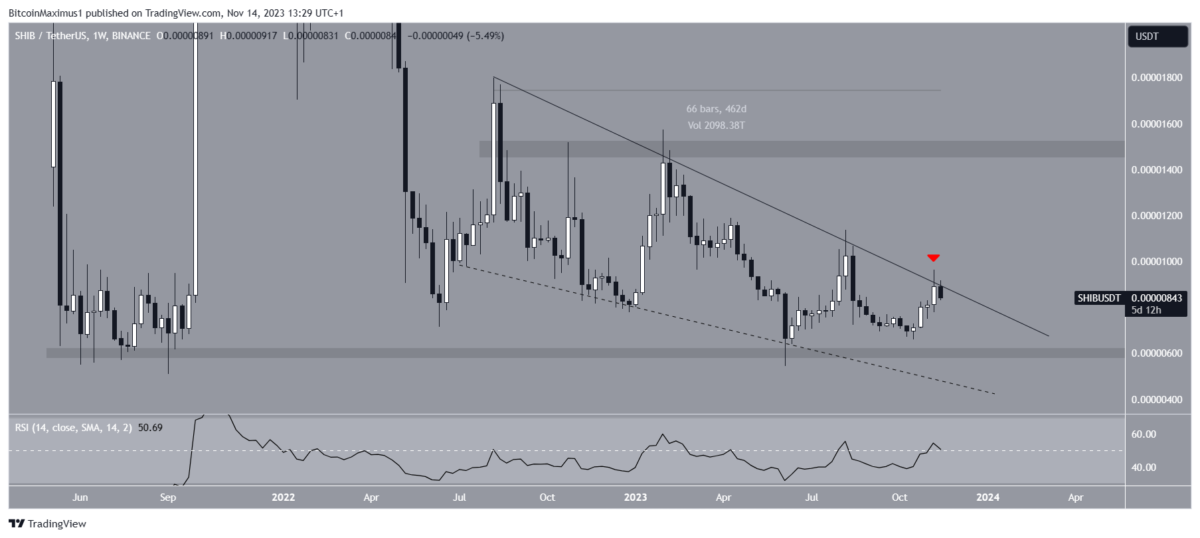 SHIB Weekly Chart. Source: TradingView
What do analysts say?
Cryptocurrency traders and analysts have a positive view on the future Shiba Inu price. In this context, the analyst nicknamed Shib Knight shared the following:
SHIB has strong support. Price action is positive, slowly increasing. As long as the price continues to follow the ascending support trend line, it suggests that the trend is bullish.
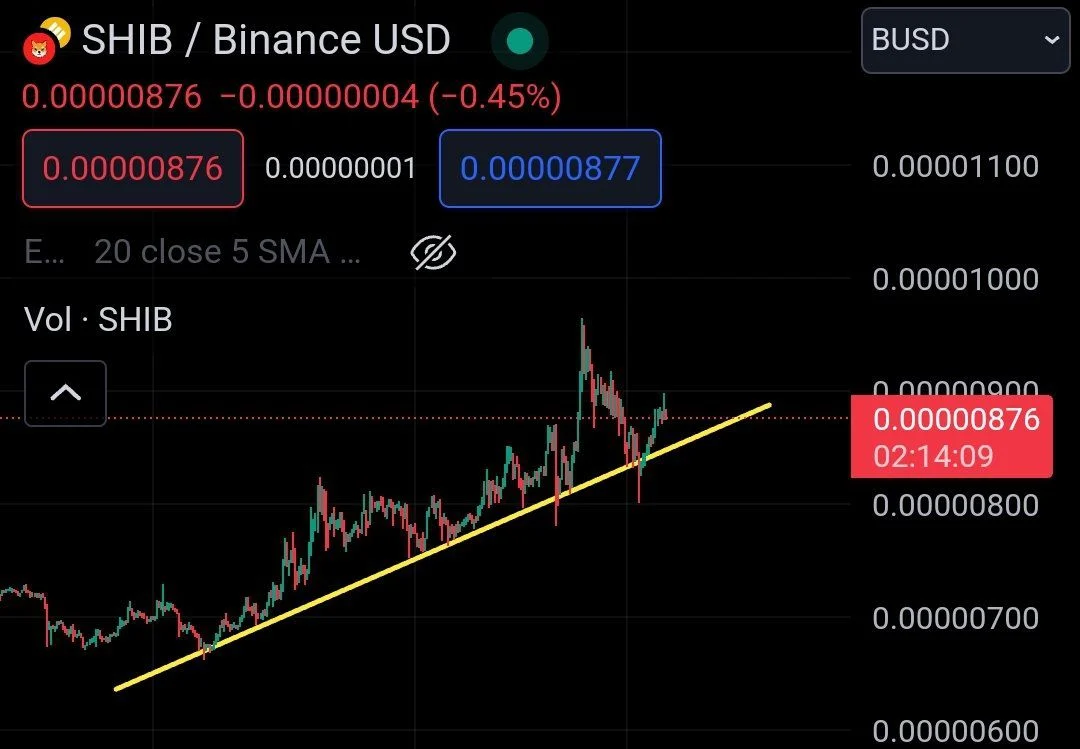 SHIB Daily Chart. Source: Shib Knight
MyAlgo, which uses a trading algorithm to enter and exit trades, notes that a bullish signal has been issued that is expected to push the SHIB price higher.
Shiba Inu price prediction: Jump or decline?
The altcoin’s outlook remains uncertain on the daily time frame. It faced rejection at the 0.618 Fib retracement resistance level, as SHIB regained the $0.00000840 level and reached $0.0000098, although it rallied from a parallel descending channel. This led to a long upper wick, which is considered a sign of selling pressure.
The previous SHIB price increase was accompanied by a bullish divergence (green trend line) on the six-hour RSI, indicating a potential upward move. A bullish divergence occurs when a price decline is accompanied by an increase in momentum. However, the RSI has declined over the last three days. Additionally, it currently stands at the critical 50 level (green circle). It should be noted that these are important for Shiba Inu price movement. Similarly, SHIB price has also fallen since the rejection at the 0.618 Fib level. It is currently trading inside the $0.0000084 horizontal support area.
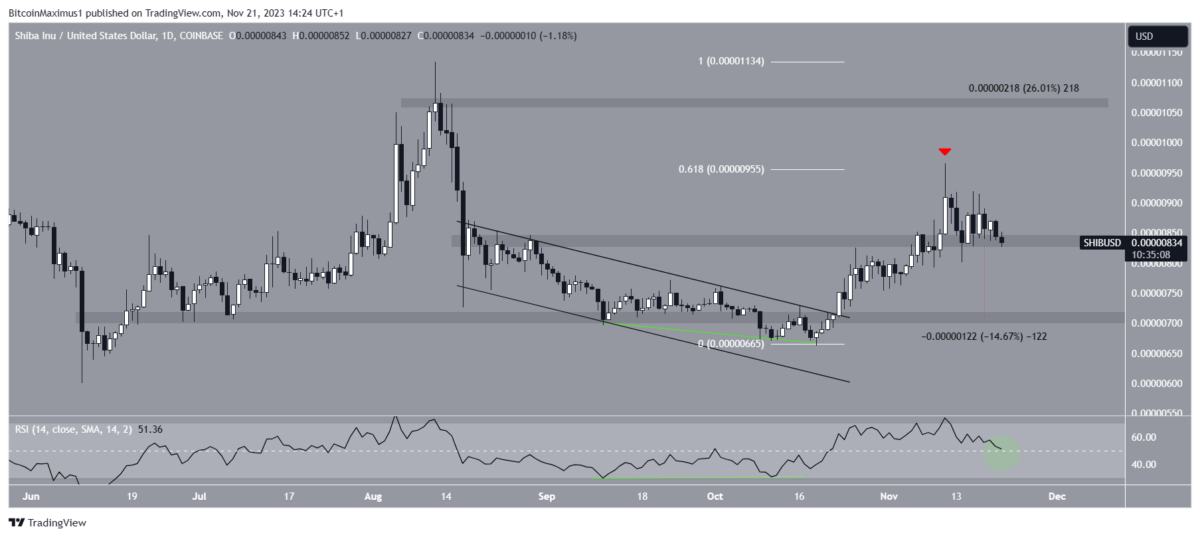 SHIB Daily Chart. Source: TradingView
In summary, the future price prediction for SHIB depends on whether it breaks below or rises above the $0.0000084 horizontal support. If it breaks this, it will likely see a 15% decline to the nearest support at $0.0000070. However, if it bounces back, it is possible that Shiba Inu price could rally towards the next resistance at $0.0000105. This means a 25% increase for SHIB.


