Bitcoin hit a six-month high on February 21 as the last attempt to turn $25,000 for support failed. So what’s next? Here are the details…
Bitcoin moves erratically before Wall Street opening
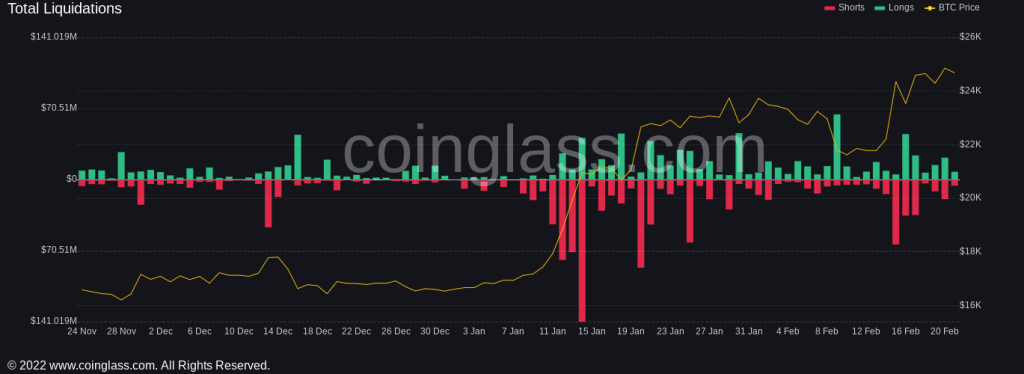
The data showed that the BTC/USD pair reached $25,250 on Bitstamp. A definitive rejection on the hourly timeframes saw the pair bounce back below $24,750 and maintain a trading range over the weekend. Bitcoin faced three days of “out-of-hours” trading with less liquidity and the risk of more volatile ups and downs. According to data from Coinglass, these have occurred to some extent and efforts to break past the previous week’s highs have been short-lived and have resulted in both long-term and short-term liquidations.

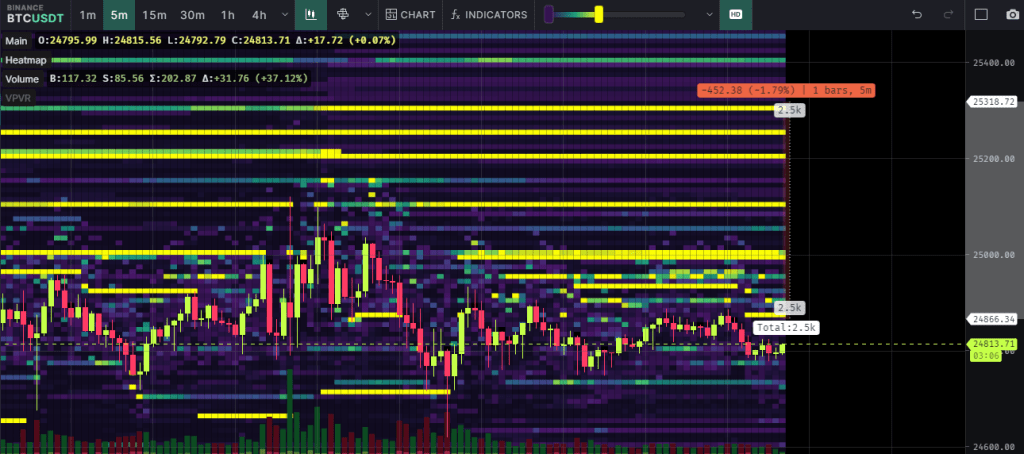
Monitoring resource Material Indicators continued to monitor the source of the sudden volatility from whales on exchanges trying to move the market with a bulk bid and seek liquidity. “There are 2500 BTC in stacked sell orders between $24.8-25.3k in BTC/USDT pair,” said popular trader Daan Crypto Trades. He then used the following expressions:
There may be three reasons behind this: 1. Actual sell orders. 2. Orders that suppress the price to fill orders before withdrawing or buying later. 3. Price reduction orders.

Analyst: BTC price action reflects July 2021
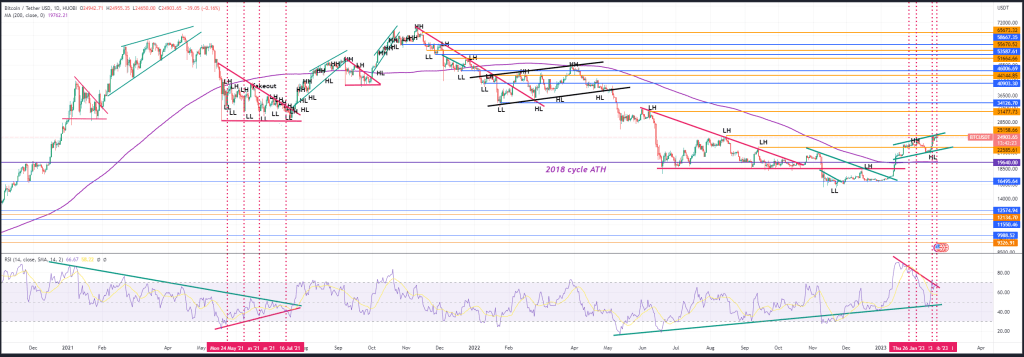
Trader Crypto Tony has likewise been cautious about the potential to overcome resistance. In a Twitter comment, “We’re past $25,000 here once again, but the question is: will we stay above this resistance zone or will we deviate and turn back?” said. On the other hand, Venturefounder, a contributor to on-chain analytics platform CryptoQuant, predicted, in an update on an existing theory, that lower lows would be retested before the upside continuation for Bitcoin.
He based this on market conditions in mid-2021, with BTC/USD hitting all-time highs in April and November, respectively. “$25,000 BTC is very similar to $31,000 in July 2021,” he argued. “Bitcoin may break above that with a ‘Fakeout’, but it will likely retest lower support before consolidation and resume its uptrend,” he said.

Venturefounder warned that macroeconomic events could weaken Bitcoin and crypto more broadly, as part of a complex set of forecasts from crypto sources for the year ahead.
PlanB announced its expectations for the next three years
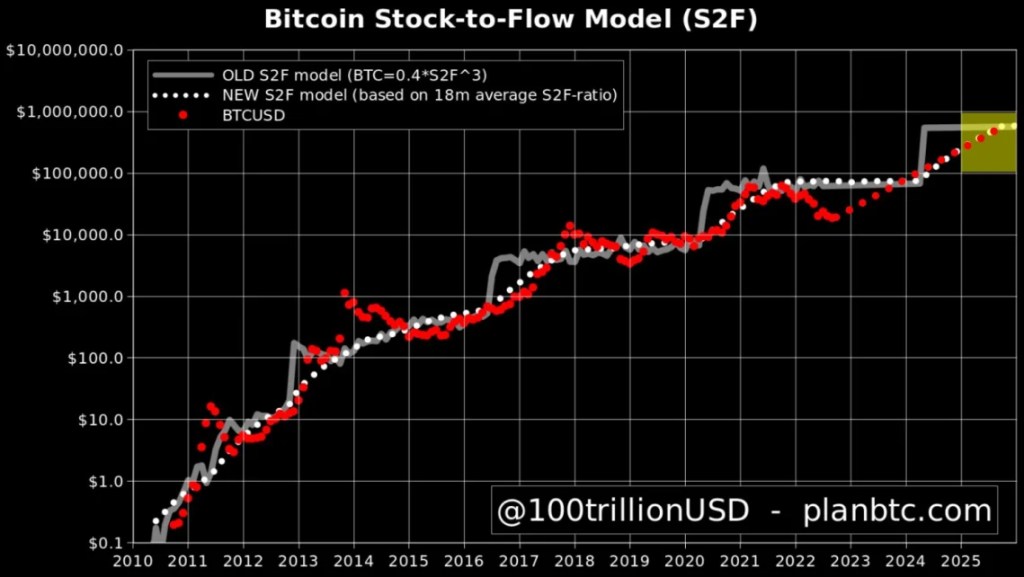
Finally, PlanB reveals its Bitcoin forecast for the next three years. In a new video, the analyst updated BTC’s stock-to-flow ratio, which is often used to predict the future price of scarce commodities. cryptocoin.com As we reported, PlanB has maintained two stock-to-flow models with slightly different variations, and says both models remain intact. He points to Bitcoin’s upcoming halving, which will reduce the amount of new supply entering the market in about a year, as the key catalyst to ignite an explosive BTC bull run.

PlanB says both stock-to-flow patterns indicate that BTC’s next peak will likely be in the $100,000 to $1,000,000 range. “I know a lot of people don’t like their estimates in the range. They say it’s too large and unusable, the model is not valid,” he adds. In the short term, PlanB says the key metric it is currently tracking is Bitcoin’s 200-week moving average. BTC climbed above the moving average last week, but has since fallen back below the average. Historically, long-term Bitcoin bull runs were triggered after BTC broke above the line.


