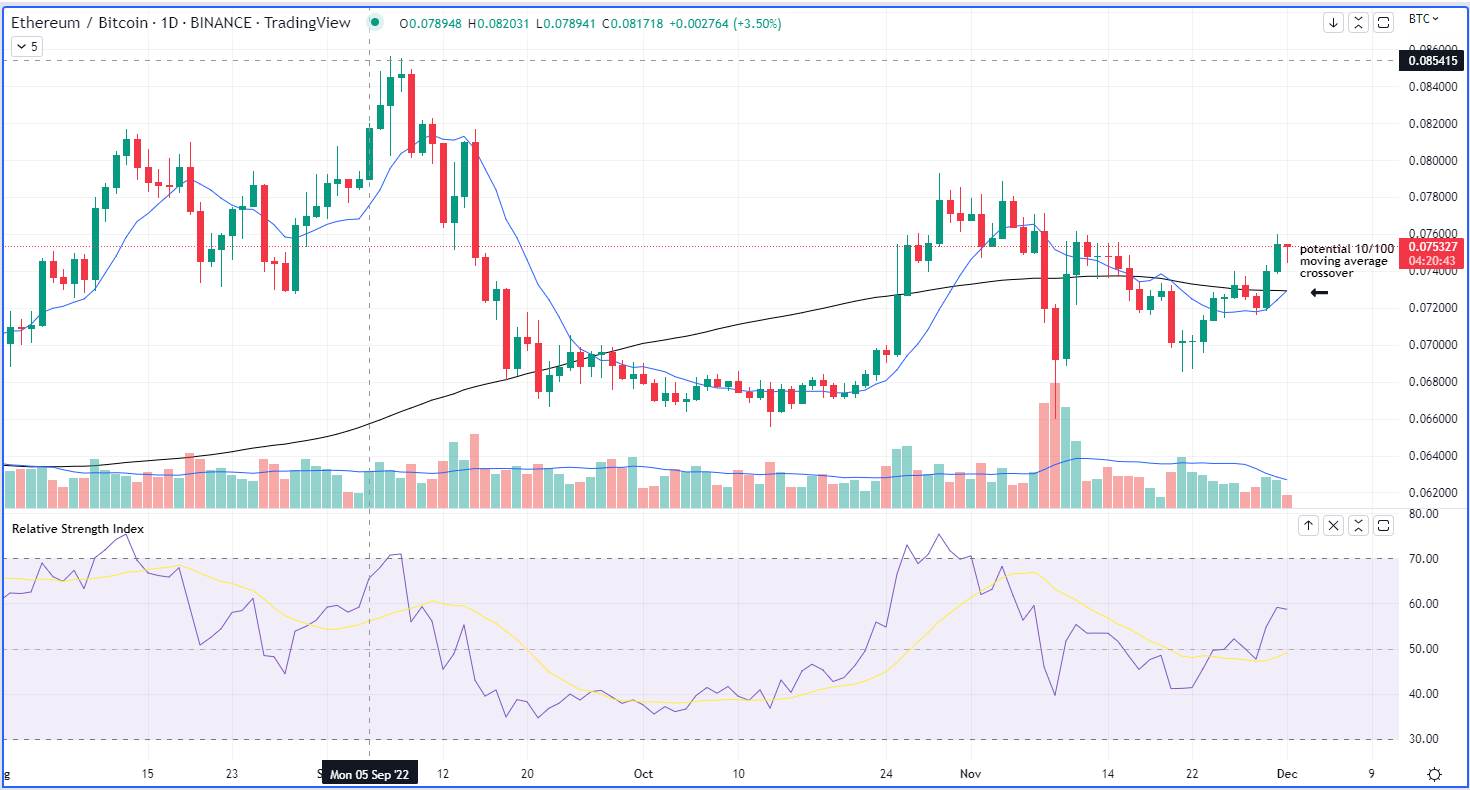
Ether’s price has outperformed bitcoin over the past 10 days, increasing 15.4% versus BTC’s 7.7% rise.
Momentum in the ETH/BTC pairing over the same time period spiked 39%, using the 14-period Relative Strength Index (RSI) as a proxy for price acceleration. The RSI is a technical indicator that measures the magnitude of price changes for an asset. It can be used by investors to determine the speed of price movement, allowing it to be compared to past price levels.
The current RSI for the ETH/BTC pair is 57.22. Filtering for RSI levels above 55 but below 58 for data dating to 2017 yields inconclusive results. In more than 1,845 observations, the RSI for the ETH/BTC pair has fallen within this range just 116 times.
The average seven-day return following each occurrence was 2.1% higher. The 30-day return was a much less impressive 0.1% increase, implying that prices have tended to trail off.
The potential crossing of the ETH/BTC 10-day moving average above the 100-day moving average is poised to occur Thursday. This so-called moving average crossover occurs when a shorter time frame moving average crosses above a longer period moving average. A positive crossover is often a bullish sign.
Data over the same time period shows positive results, but also highlights how infrequently it has occurred. Since 2017, data shows that the 10-period moving average of the ETH/BTC pair has crossed above the 100-period moving average just 16 times.
Over that time frame, the average seven-day return following the crossover was 1.5% higher, while the average 30-day return expanded to 6.1%.
The data suggests that a crossover is either such a rare occurrence that it should be exploited immediately, or that the sample size isn’t large enough to come to a definitive conclusion. I fall in the second camp as I view the crossover as meaningful but warranting more observation before putting capital to work.

Ether/bitcoin pair for Dec. 1, 2022 (TradingView)


