Bitcoin and ether started the week positively, increasing 2.6% and 2.5% respectively in early Monday trading.
Bitcoin (BTC) is trading 3% below its 20-day moving average of $28,300 while ether (ETH) is trading 1.9% below its respective 20-day average. Investors will likely be watching to see if both assets can recapture their average, following a breach of the lower end of their Bollinger Bands in the prior week.
Volume will be key to watch, as the sentiment behind any directional move will be amplified or muted by the level of trading volume. While volume across all spot markets spiked 34% and 35% for bitcoin and ether respectively on Monday, activity for both trails their 30-day moving averages.
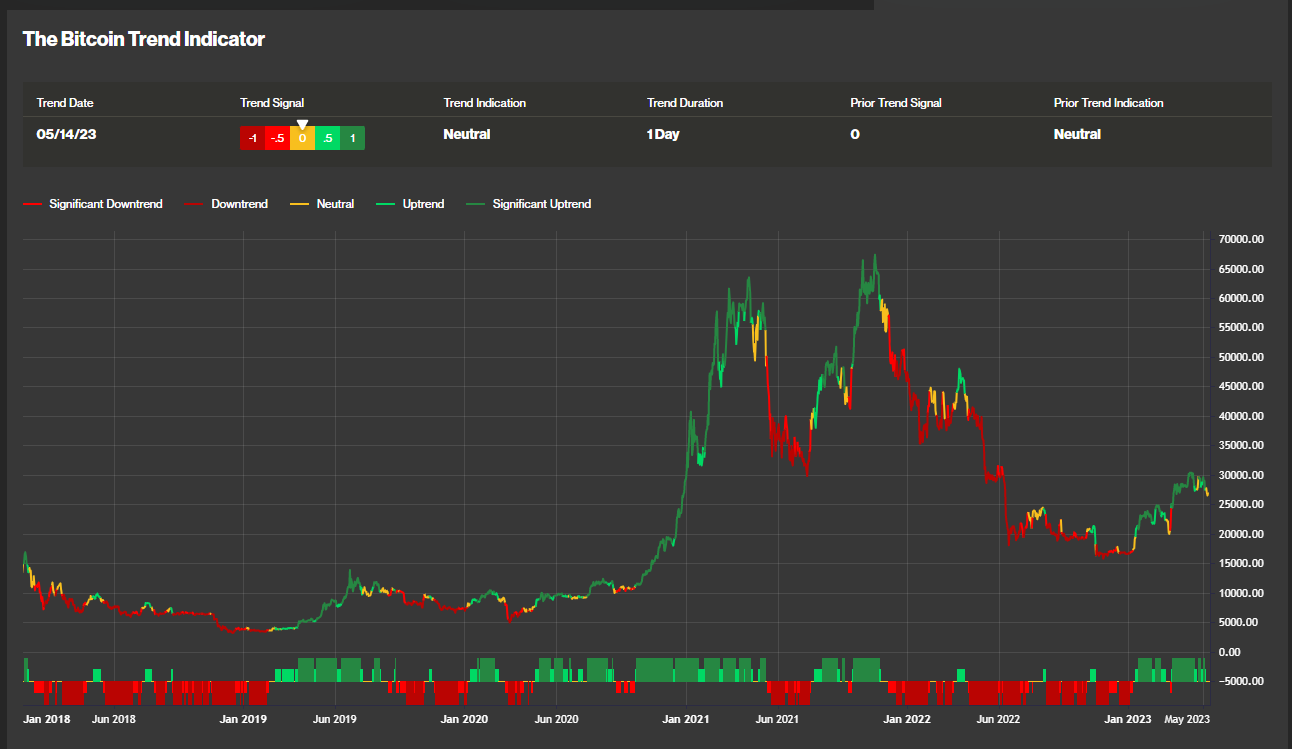
The steady decline in trading volume for the two assets implies a reluctance for new market participants to take on risk, and existing market participants to add more. As an illustration of such, CoinDesk’s Bitcoin Trend Indicator remains within the “neutral” range that it signaled on May 10.
The relative strength index (RSI) readings for both are nestled in a neutral range as well, with bitcoin’s at 44.17 and ether’s at 46.25. The RSI indicator ranges from 0 to 100, and is often used as a proxy for momentum; readings above 70 imply that an asset may be overbought, while readings below 30 indicate that an asset may be oversold.
Since 2015, BTC and ETH’s 30-day performance following similar RSI readings has been relatively mild, with bitcoin historically finishing 4.1% higher, and ETH finishing 2% lower.
Absent an external catalyst, investors may read the direction of stablecoins as an indication of where prices are going next. The stablecoin supply ratio (SSR) is a bitcoin-specific metric, measuring BTC’s market cap versus the market cap of a basket of stablecoins.
Lower volumes indicate greater buying power while higher values indicate the opposite. In this regard, the 11% decline in the SSR since May 5, implies that additional buying strength exists within BTC markets.
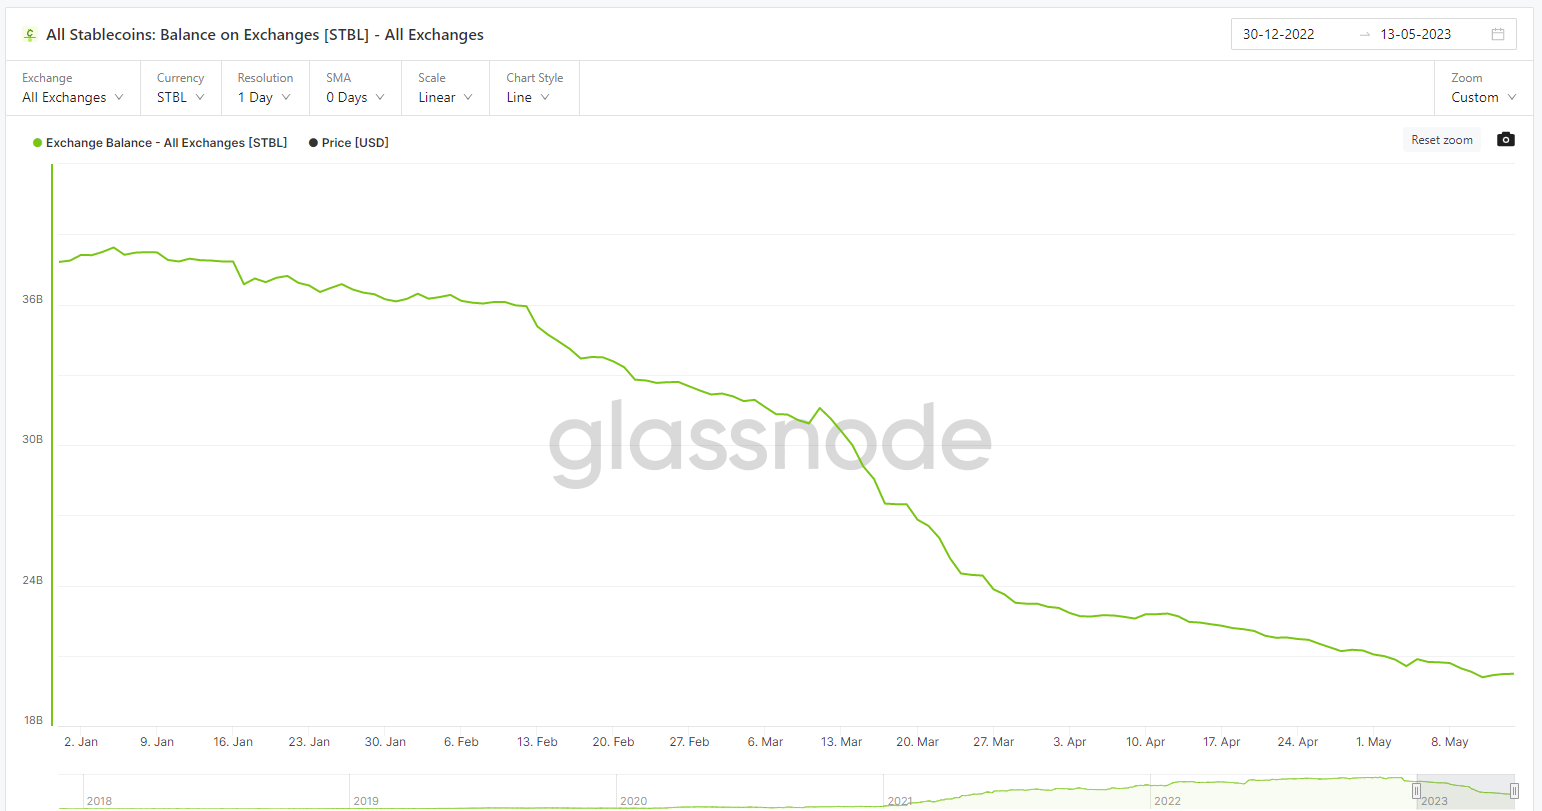
The aggregate supply of stablecoins on exchanges measures the total supply of stablecoins held on exchange addresses. Increases in aggregate supply are an indication of additional capital available for deployment across all cryptocurrencies.
Stablecoin exchange balance is down 47% year to date, despite BTC and ETH trading 65% and 53% higher on the year. An increase in stablecoins supplied to exchanges however, could serve as a signal that prices are poised to move higher.
Recommended for you:
- Sam Bankman-Fried Blogs Like a Crypto Robin Hood, but in Court He’s Not So Charitable
- U.S. Fed’s Supervision Chief Investigating What Happened With Silicon Valley Bank
- Bitcoin Miner Hive Delays Latest Financial Filings Till End of February